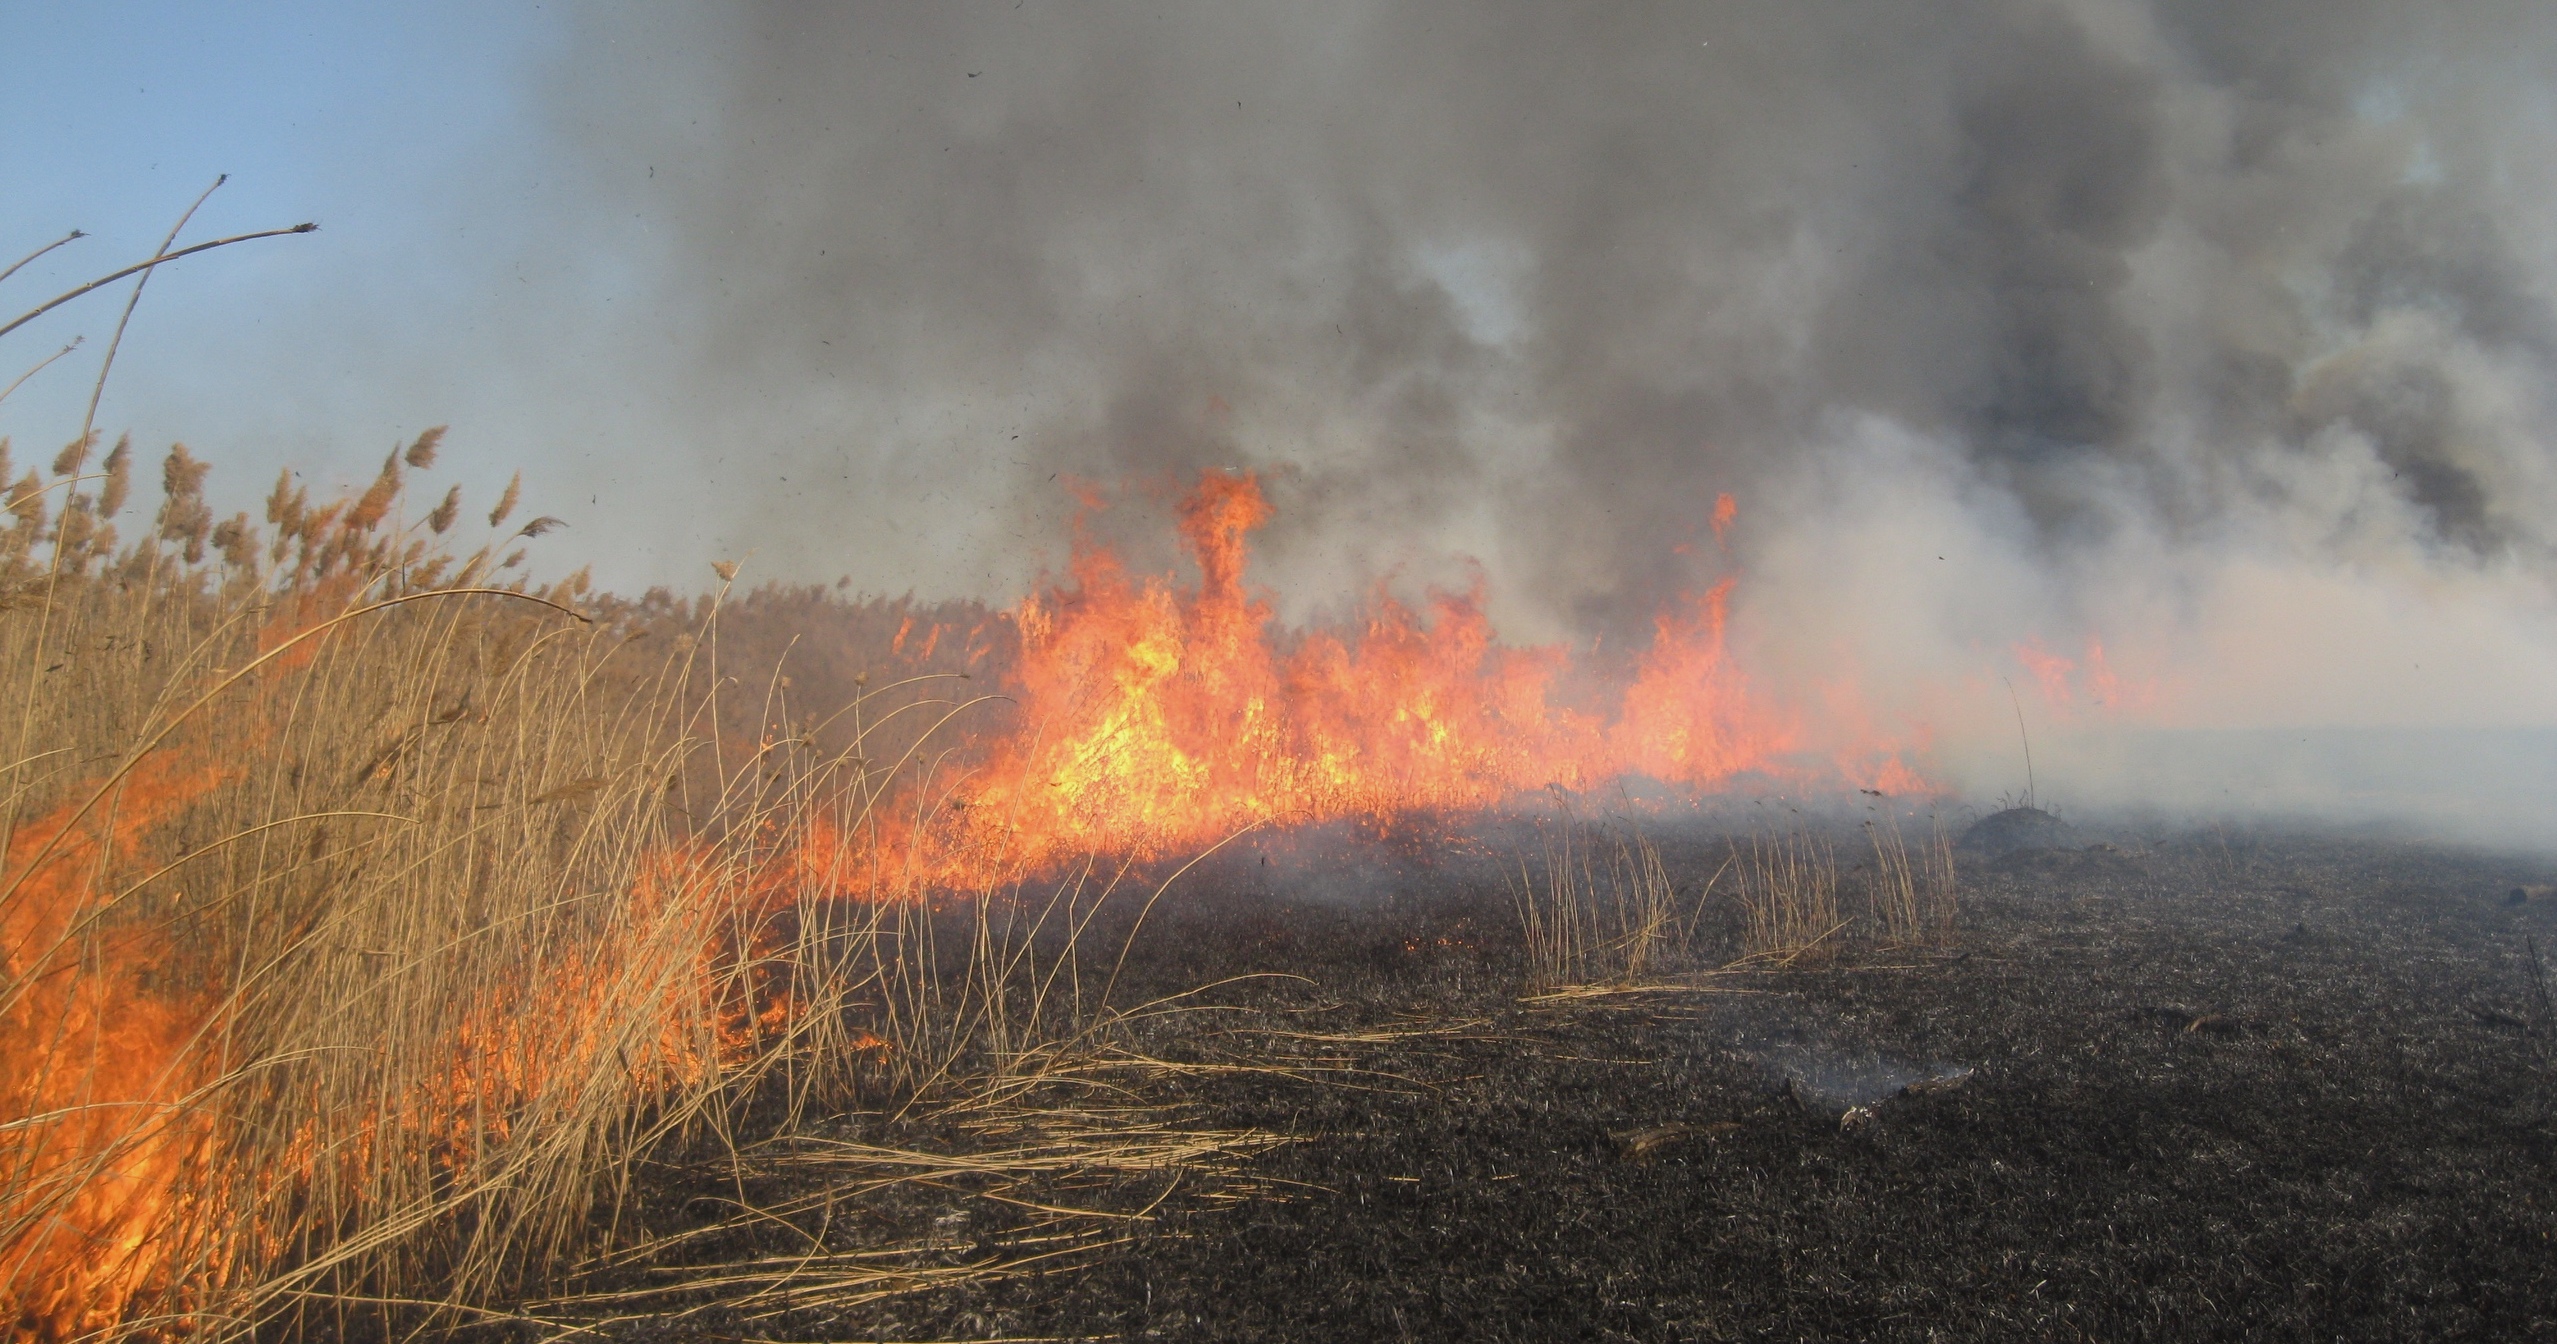
Wildfires are detrimental to both environment and economy. The responsibility to monitor and fight them are on the state, but public can help.
Together with “Public initiative against environmental crime” we have developed “Clear horizon” – a system for participatory fire monitoring and reporting — clear-horizon.ru.
The idea is simple: wildland fires are responsibility of various state entities, so a system can be built that will collect geodata on fires and automatically (or semi-automatically) prepare and send inquiries to these entities.
Russia burns a lot. While operational response more or less works there are lots of problems with follow-ups where investigation is needed, perpetrators are to be found and damage is to be covered.
State often is not motivated to do that if there are no official requests from the public. “Clear horizon” helps initiate such investigations and prosecute violators. If such work is systematic we believe we will have less fires.
Currently the project is operational in 6 southern regions of Russia: Krasnodar, Adygeya, Kalmykia, Rostov, Astrakhan and Stavropol.
Here are technical details about components of the system.
Web GIS
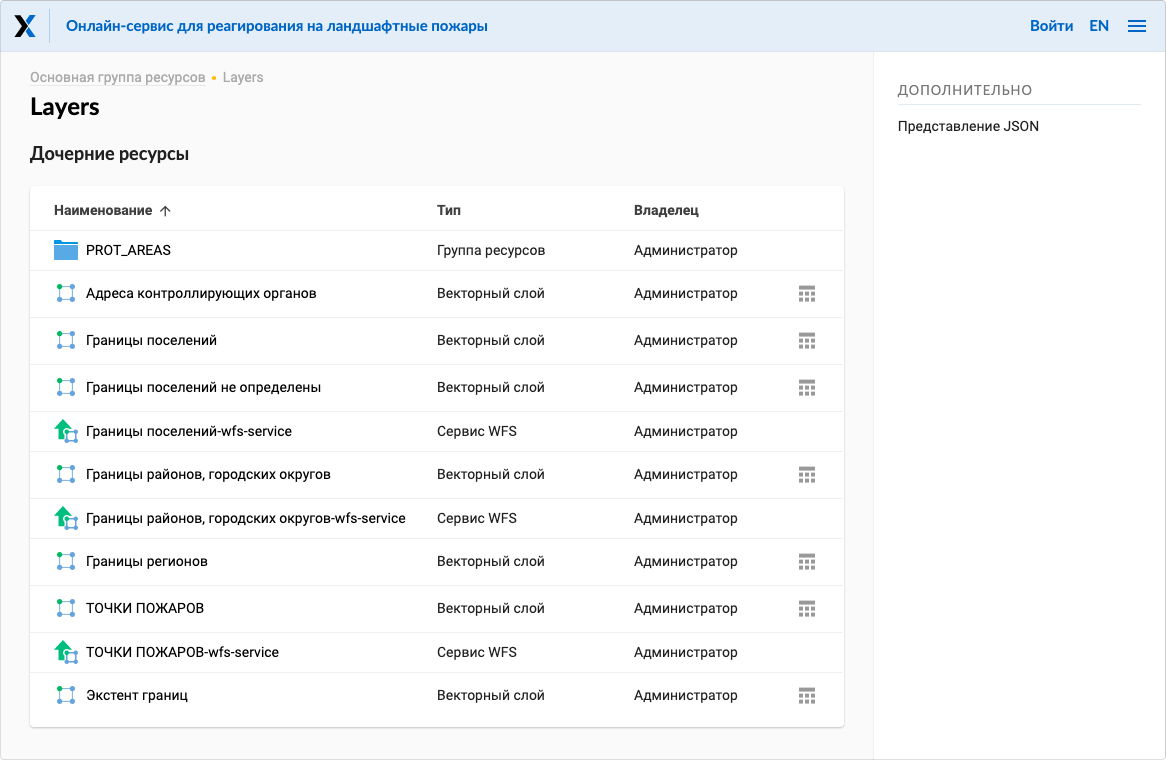
The system core is Web GIS — the place where the following data are collected:
- user-generated fires data,
- fire service data (FIRMS),
- additional layers used for analysis,
- lists of responsible organizations.
Different sub-systems of the project: visualization, collection and analysis are exchanging data with the standard cloud-based Web GIS through API. Web GIS management is done via browser or NextGIS QGIS.

Data collection
Fire data are coming from two sources. The first is Fire Information for Resource Management System (FIRMS) by NASA which provides global fire hotspot data. These data are used for information purposes only, visual control. The second is data collected in the field.
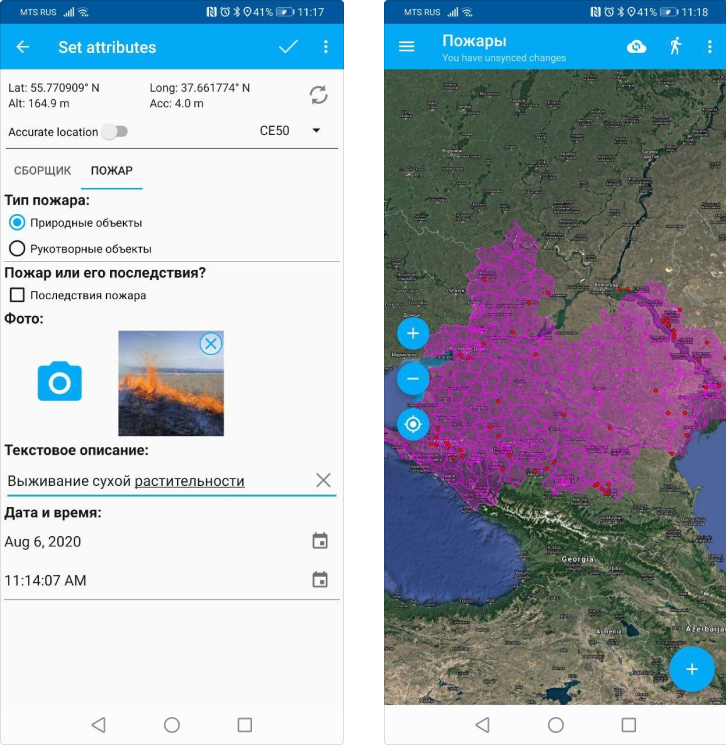
Field teams are equiped with NextGIS Collector — mobile app that allows to collect structured data on the fire event and add photos. To start the participant only need to login with the app. The specialized data collection form is build with NextGIS Formbuilder.
Collected data is synced with Web GIS and utilized in few ways.

Visualization
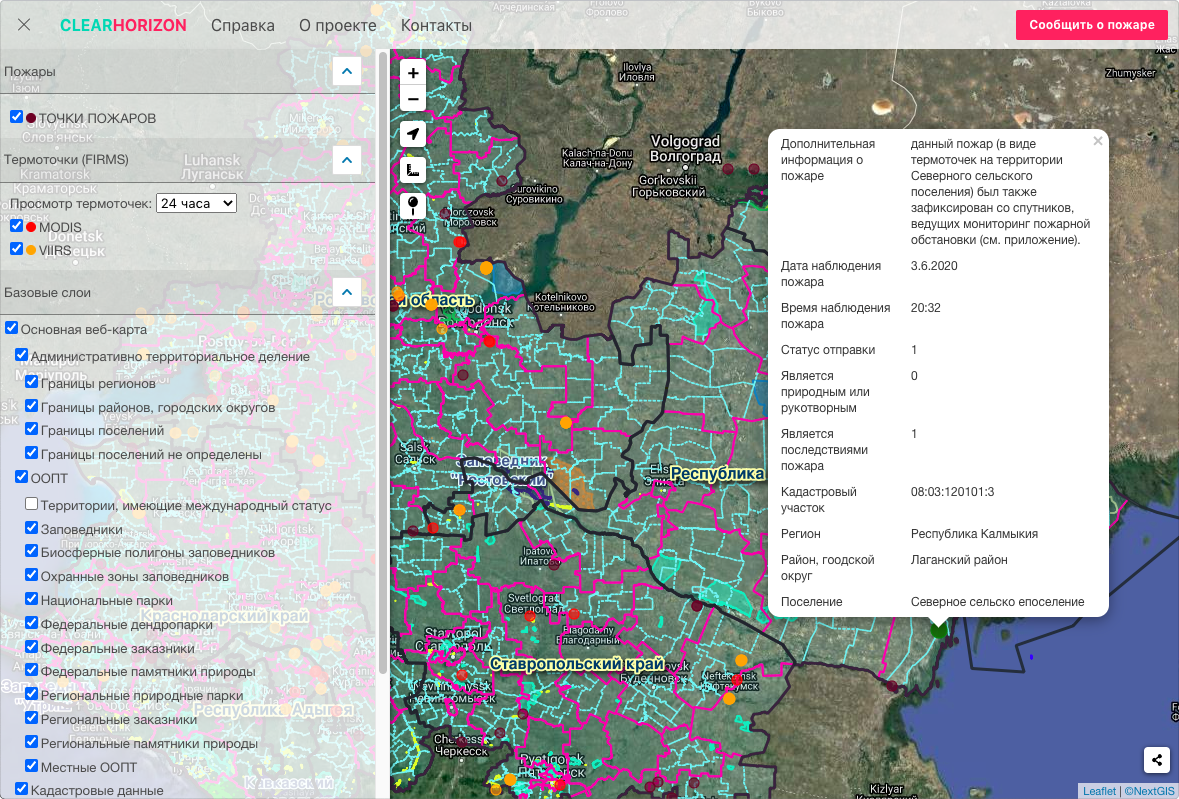
The first step is to visualize what and where was collected by the field teams. Information is displayed using a special map showing:
- FIRMS fires data (last 24, 48, 72 hours or a week),
- Field teams fire data showing all the attributes and photos,
- Administrative division,
- Borders of protected areas.
The map is built with NextGIS Frontend and configured automatically, i.e. no developers are needed to add or change layers.
Reports preparation
The most unconventional part of the system is special processing.
A robot is periodically:
- queries collected user data, administrative and protected areas boundaries (these are updated from time to time),
- checks were fires have happened and determines which state entities are responsible,
- checks official cadaster data to get official identifiers of land plots,
- prepare reports using templates different for different situations (type of fire, type of entity, type of land plot etc.),
- sends email to official state entities.
Conclusion
A particular feature of this project is its high modularity. Thanks to ready components of NextGIS platform we were able to keep additional development to the minimum and ensure quick start of the project.
Thanks to modern technology and NextGIS software we managed to create a reliable practical tool accessible to public. The manifestation of civic consciousness has never been so accessible and convenient.
You can subscribe and start using NextGIS services right away!

