We are glad to present our brand new project “Boundaries of Russia and precursors in 1462-2018”!
This mapping project shows the dynamics of political boundaries of Russia and its precursors during the period of 1462-2018. We’ve been working on the technical part of the project for the last couple of months, together with Runivers and the Lab of Historical Geography and Historical Cartography at the Institute of World History of the Russian Academy of Sciences.
Live: http://map.runivers.ru
You’ve probably seen many examples of such visualizations, here are the main differences from similar projects:
Here we present some details on the technological challenges we faced while working on this project.
Goal: Avoid drawing polygons
The first task was to find an effective way to generate data. Right from the start we have decided against drawing polygons. Drawing lines is much easier and more convenient because less time is spent on verification of the topological correctness.
Specialists from Lab of Historical Geography and Historical Cartography at the Institute of World History of the Russian Academy of Sciences Lab drew each linear section of Russian boundaries. The sections were cut or expanded as they changed over time. Each section was assigned attributes to indicate the period (beginning and end) of its existence. No line sections were deleted. Lines were also supported by a point layer with additional attributive information. Two later were combined to form resulting polygons. Both the drawing and attributes filling were completed in NextGIS QGIS.
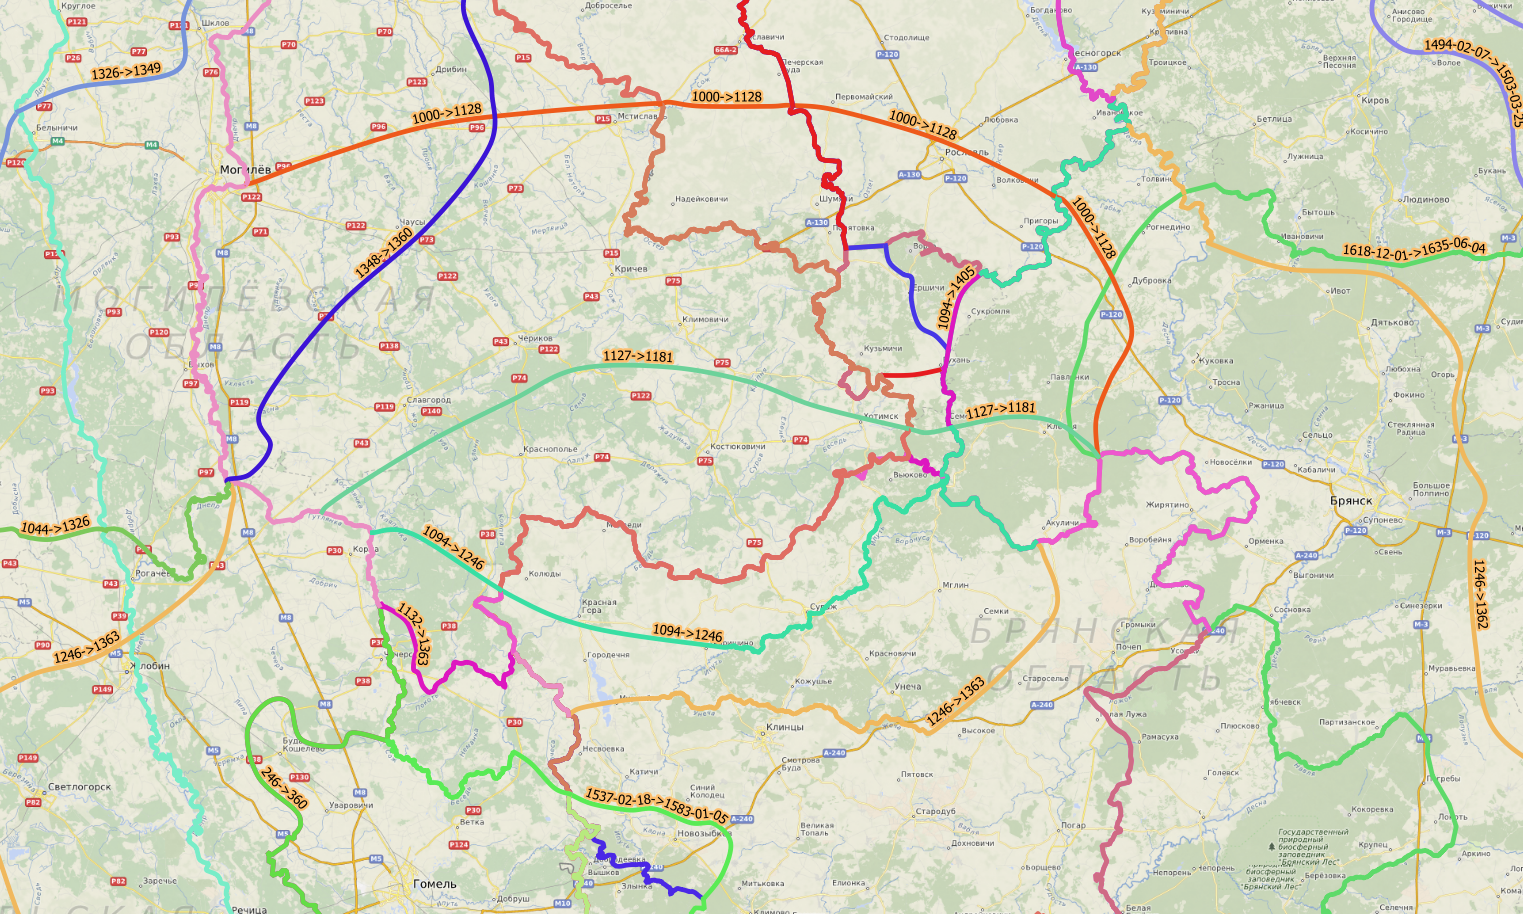
An example of boundaries changes in Bryansk (Russia) and Mogilev (Belarus) regions. Different sections are shown in different colors. Periods of existence of sections are numbered.
Goal: Easy polygon re-generation from constantly changing source data
Drawing lines is easier, but the result still had to be regions (polygons). So we needed a method that would build polygon topology from the sections database. We implemented this as a specialized processing web service using NextGIS Toolbox. This service was run as often as needed by the History Lab specialists, without our interference. When a considerable number of changes was accumulated, the processing service would:
NextGIS Toolbox is our processing environment which automates the processing of geodata and makes it easy for non-programmers to run. You can find more examples of its use in this additional use-case article.
Goal: Easy way to download and update time slices data, provide vector tiles
Time slices data created by the processing service was checked and uploaded via NextGIS Connect to NextGIS Web – our server Web GIS used by organizations to manage geodata.
Time slices would occupy about 50 Mb each and such volumes couldn’t be sent to a web browser because of the sheer size. The raster model was also deemed unsuitable, as the resulting map was supposed to be interactive, the polygons need to be “clickable”. We chose vector tiles for data transfer. NextGIS Web can be used as a server of vector tiles, generating them from vector layers. Tiles can be queried in a standard way:
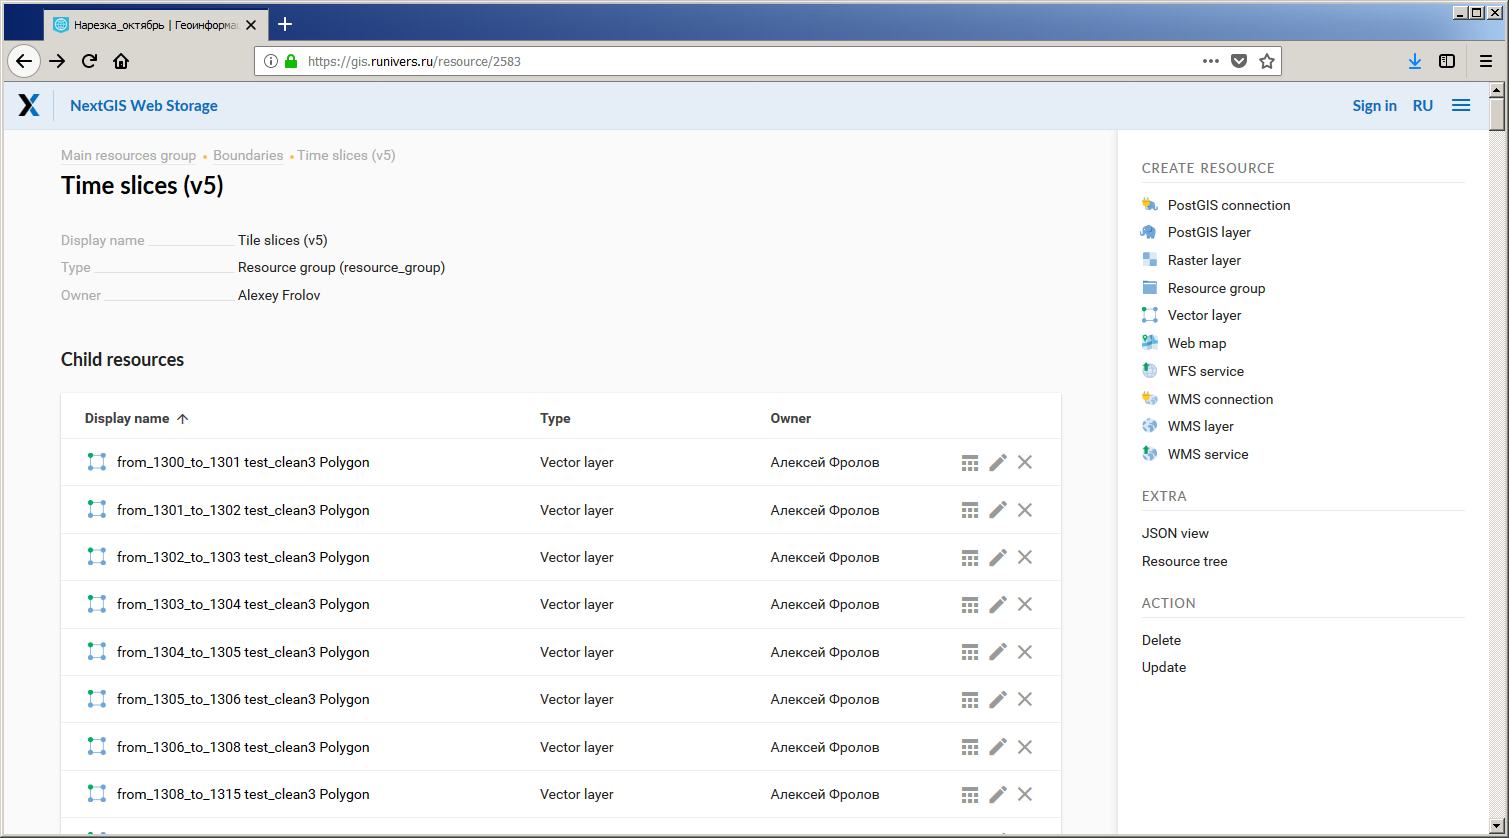
Time slices storage in NextGIS Web interface
Goal: Fast visualization of time slices on a basemap with animation that doesn’t block navigation
Servers and services are all good, but ultimately people are supposed to work with this data in a client application (Web map). This is what it needs to be able to do:
The app is based on NextGIS Frontend – set of special libraries that facilitate the development of cartographic apps. NextGIS Frontend gives the opportunity to connect different cartographic frameworks using adapters like: Mapbox GL JS, Leaflet, OpenLayers. Here we used only Mapbox GL JS.
Wherever it was possible we used our own libraries: map initialization, adding layers and controls (Webmap module with mapboxgl-map-adapter); managing basemap layers (qms-kit to work with QuickMapServices); consuming NextGIS Web resources using ngw-connector. Fortunately, library usage doesn’t reduce the opportunity to work with the cartographic framework itself. This project is an example of how one part of the work can be completed using the interface of NextGIS Frontend, and another part – using the standard Mapbox GL JS methods.
The original app code is available on Github.
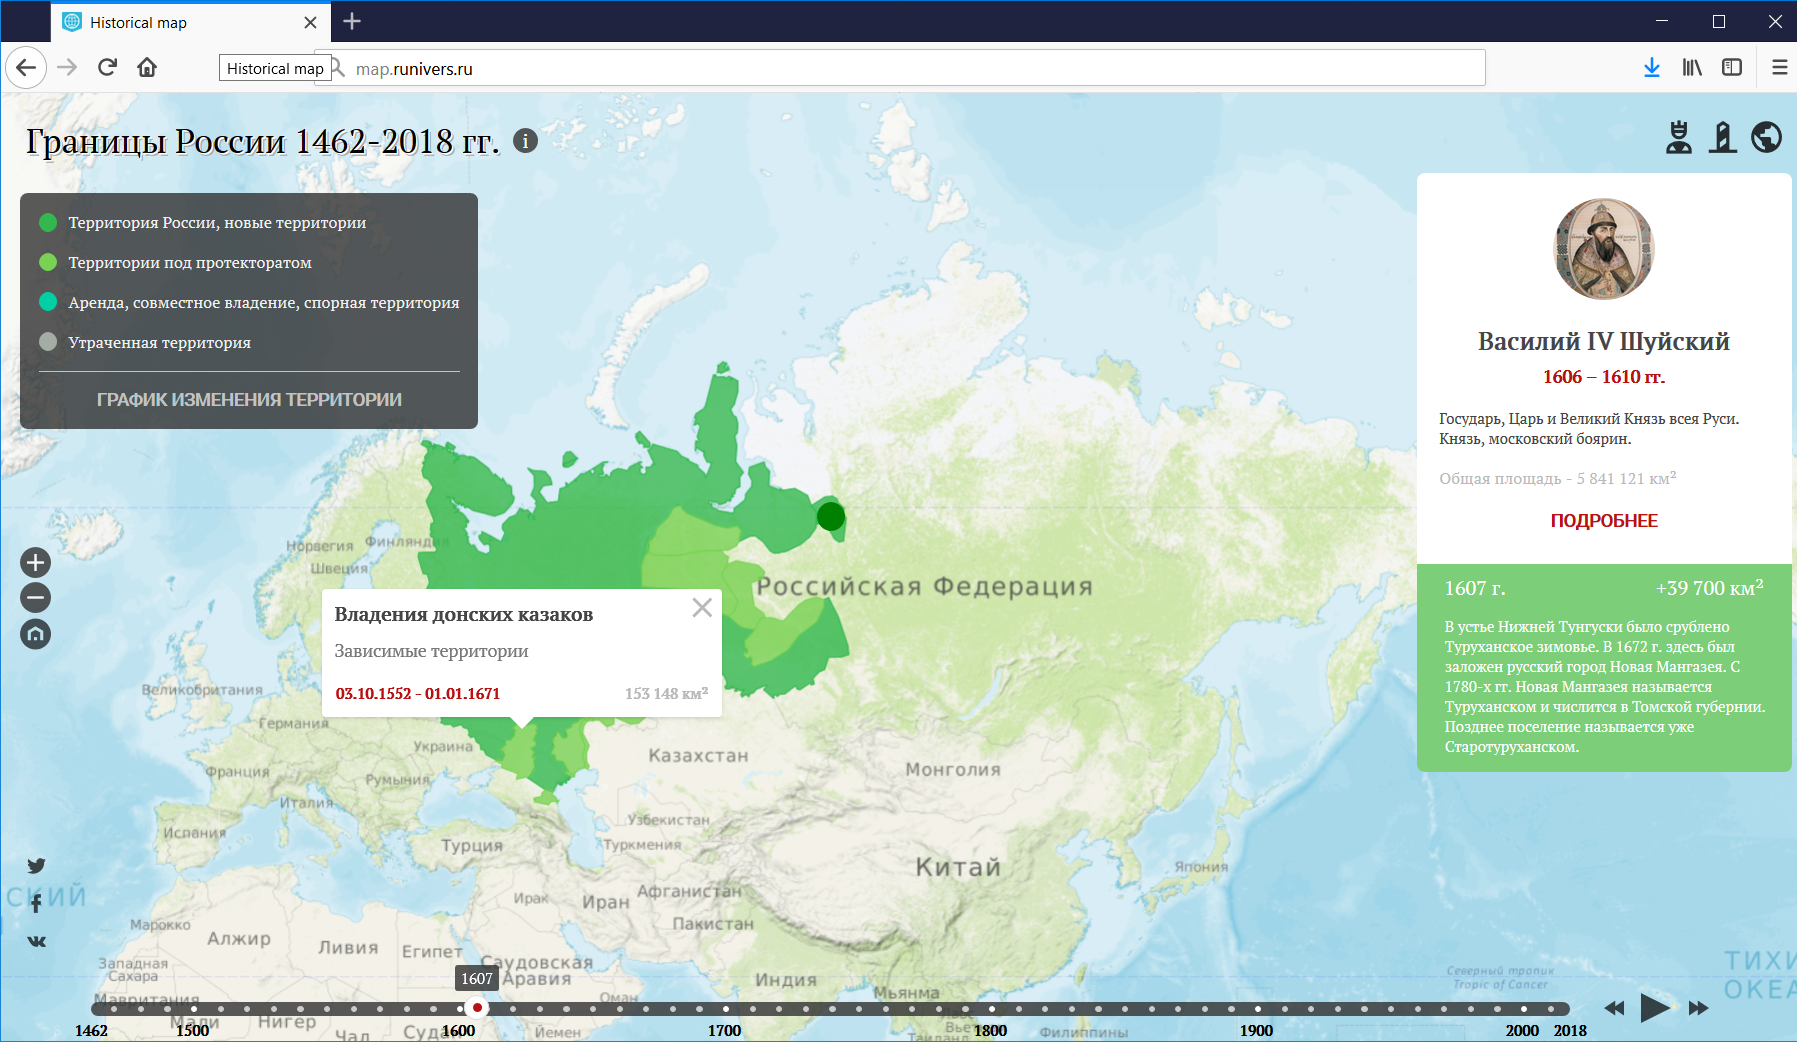
Final cartographic web-app. Click to go live.
NextGIS develops mapping projects and provides software for your development team. Contact us, we’d love to share our expertise with your company!


One Response to Russia and precursors, 1462-2018