Many industrial and exploration companies have their personnel working outdoors and dependent on weather conditions. Even with lightning protection in effect, the risks of being struck by a ligntning are present and increase manyfold during thunderstorms. The risk is especially high for people working on elevated metal constructions, near power installations, etc. Some works and technical operations there must be finished strictly before a thunderstorm starts.
To lower the risks of employees’ health and corporate property damages NextGIS, together with Groza LLC, has developed Groza GIS. Groza GIS is a geographic information system which allows to visualize lightning strikes around an industrial object and send warning notifications to the system operators.
Project Summary
The project aim is to create a geospatial system which will display a current lightning situation and will inform its users about the risks of lightning strikes in areas where target objects are located.
Project Goals
- To display a lightning situation for a past hour and inform about approaching thunderstorms in real-time mode.
- To provide lightning strikes archive data for a set period of time.
- To notify about thunderstorms entering different alert zones.
Background
Groza GIS works with lightning data. Lightning is a location of a lightning discharge registered on the surface. Lightning details contain: date and time of a discharge, lightning type (cloud or cloud-to-ground), lightning discharge polarity, lightning discharge amplitude (current). Another crucial factor is a relative time of a lightning discharge – the significance of a lightning strike event for monitoring purposes is directly connected to how much time has passed since the event.
Lightning strike landing coordinates aren’t exact so they come with 95% probability ellipsis. The ellipsis shows the area where lightning strike likely landed.
Simple “points-on-the-map” kind of visualization won’t be enough to alert the user about a critical situation (i.e. thunderstorm is starting in a vicinity of an important structure). In this case lightning locations analysis is down to the operator and increases their workload.
To simplify the lightnings monitoring Groza GIS allows to set up alert zones. Alert zone is a polygon where lightning strikes are being counted. Alert zones are the basis for notification logic about possible starts of the thunderstorms. Alert zones class (danger class) describes conditions under which an operator should get a notification.
Groza GIS defines three classes of alert zones. First class – buffer zones around the most important structures (for example, a powerline pole where people are currently present). First class alert zones are typically smallest by area. When certain number of lightning strikes is reached within the zone it starts blinking red. Second and third classes represent lower danger zones, they are larger and use less critical colors for alerts, orange for the second class and yellow for the third.
Data Flow
This is how data from a lightning strike event flows to a Groza GIS operator.

So the data about lightning strikes is obtained and transferred in this manner:
1. A thunderbolt strikes and is registered by a system of sensors deployed on the surface.
2. Sensors transfer data to a ТОА-based central server of a lightning direction-finding system.
3. Groza GIS receives regular updates from the central server.
4. The received data is displayed in operator’s web browser.
System Architecture
Groza GIS comprises the following components:
- TOA service gateway. This component ensures delivery of the lightning data to both real-time and long-term data storage.
- Long-term data storage which retains data on all lightning strikes registered by the system. NextGIS Web with custom-made extensions is used as the long-term data storage. This component is necessary for the “Archive” data browsing mode.
- Real-time data storage which is used for keeping data on the most recent lightning strikes, tracked down during a set period of time (as a rule, this period is set to 1 hour).
Here you can see a chart explaining the data flows between Groza GIS components.
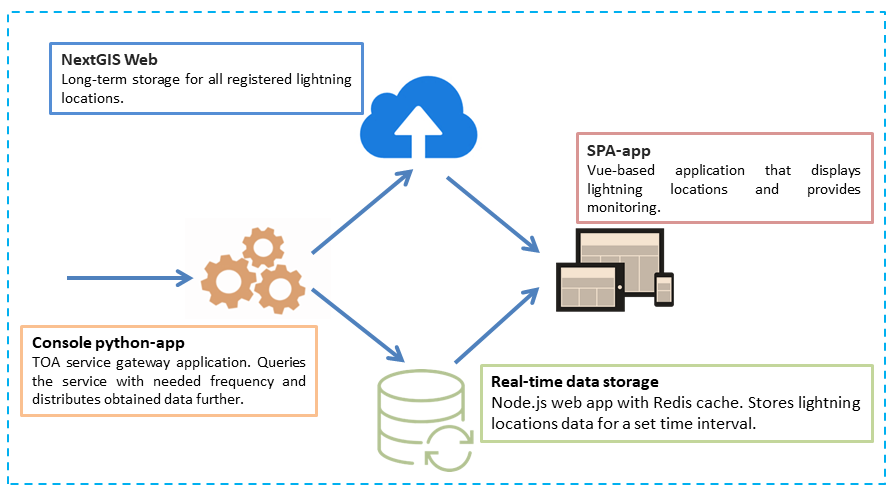
GIS Groza system architecture
NextGIS Web
Groza GIS is built as a set of extensions for our main Web server application – NextGIS Web. As a result, the following functionality is available out of the box:
- Web interfaces for data upload/download;
- Interactive web map creation for a managed geographic context (for example, your company infrastructure, boundaries, etc.);
- User management;
- API.
NextGIS Web constantly evolves and Groza GIS regularly gets its updates.
")
Lightning strikes locations in a related enterprise infrastructure context (set up by administrator)
User roles
System administrator
System administrator installs components of the system on the server and sets them up based on corporate network security and other relevant IT policies. System administrator also creates accounts for Groza GIS administrators and provides them with instructions on how to load initial data.
Administrator
Groza GIS administrator manages users and their permissions.
Also administrator uploads initial alert zones layers. These layers are created in NextGIS QGIS desktop app and uploaded to Groza GIS using NextGIS Connect plugin. Uploaded layers are used to set up alert zones.
Setting alert zones
After initial set up, data upload and alert zones set up Groza GIS is ready to be used by its operators.
Operator
Groza GIS operators have two working modes: Monitoring and Archive.
In Monitoring mode operator can track lightning locations for the last hour. The locations are updated in real time and shown in different colors based on when the lightning strike occured. Markers also determine type and polarity of the strike. Zone alerts notifications are also shown in this mode.
Monitoring mode – example of alerts for the first and the second class alert zones (admin boundaries are used as zones)
In Archive mode the operator gets access to the long-term data storage and can display on a map lightnings for a required time period. Color coding helps to quickly identify type, polarity and amplitude of a stike.
Groza GIS is available for your company — Let us know if you’d like to start using it.