We have launched an experimental service that adds fire hotspots data from NASA FIRMS for any area of interest. As part of testing, we are happy to activate this service for any Mini or Premium user.
To activate this service, please send us a link to your Web GIS.
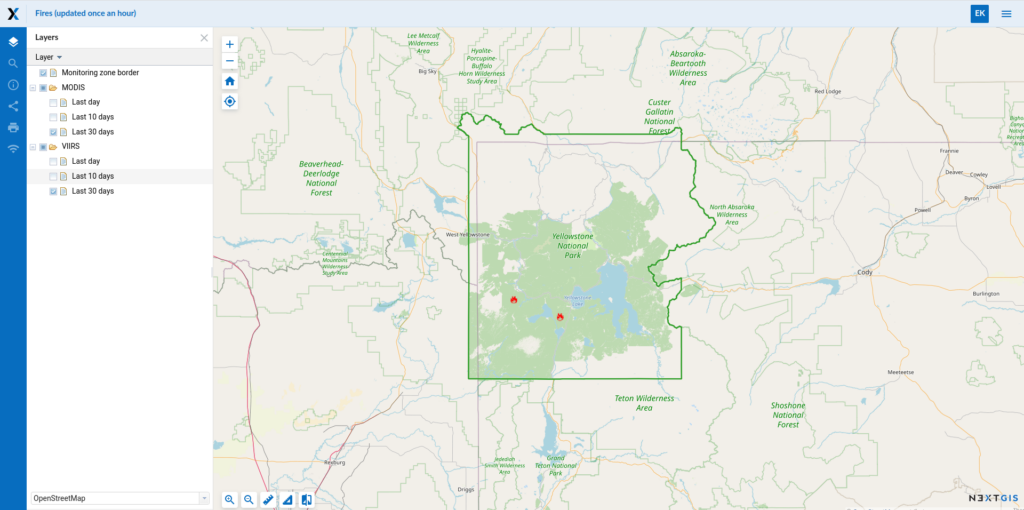
On activation fire data (hotspots, thermal anomalies) will get automatically added to your Web GIS. A web map for monitoring is created automatically, the data is updated every hour. You can add the received data to any of your web maps.
The service doesn’t just display fires in real time – all data is accumulated in your Web GIS. This allows it to be used for subsequent analysis and visualizations.
The data sources are MODIS, VIIRS and VIIRS-SNPP (NOAA) satellite sensors. The resolution of the VIIRS system is higher and it detects smaller fires with an average area of 8 ha. The use of sensors from both systems gives a full picture of fires.
View demo example or contact us to activate the service.