We are pleased to present a list of updates in NextGIS Web.
Learn more about all the changes since the beginning of this year.
The most significant improvements are illustrated with screenshots and video.
NextGIS Web generates tiles from uploaded raster and vector data. Additionally, it now supports pre-made tilesets. Upload a tileset to NextGIS Web and work with it just like with any other resource.
Uploading a tileset is useful in several situations:
We have implemented a new OGC API Features service with support for reading and writing of the features.
This service represents the latest standard from the Open Geospatial Consortium for publishing vector features. We keep track of the developments and trends in other systems to make deploying spatial data infrastructures more accessible for you.
We have separated the initial and restrictive map extents in Web Maps. This means that you can configure the map to open on a small focus region by selecting a layer or coordinates of the region, while restricting navigation within a larger area.
For example, you make a map with a constraining extent for an entire country. But thanks to a separate initial extent setting, the map will be opened on a specific region of that country.
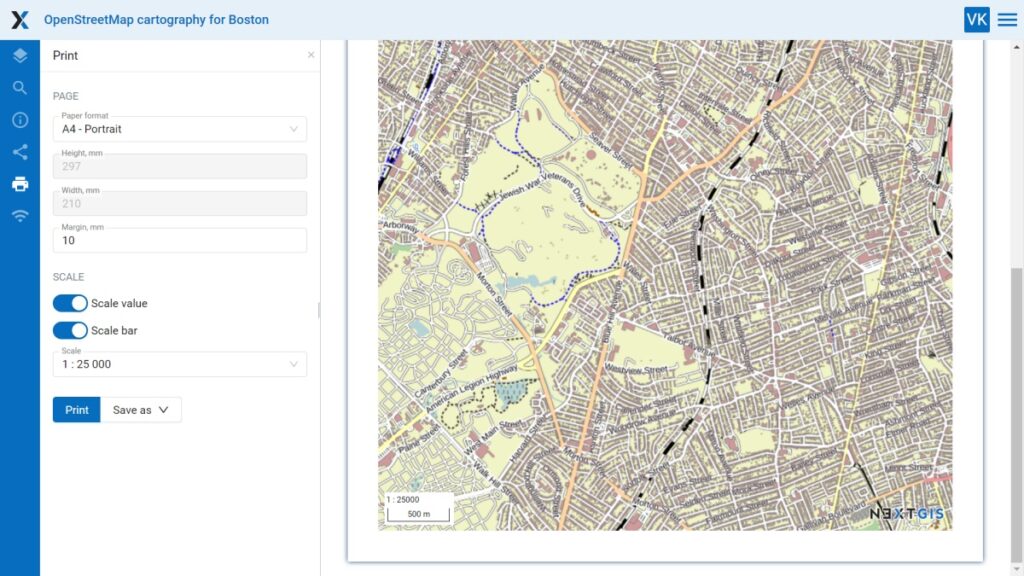
Now you can save a Web Map as a PDF file. To do this, go to the “Print” tab in the Web Map display window.
— Choose page formats: A3, A4, or customize the size.
— Adjust margins as needed.
— Enable or disable the display of the scale value and scale bar.
— Customize the scale.
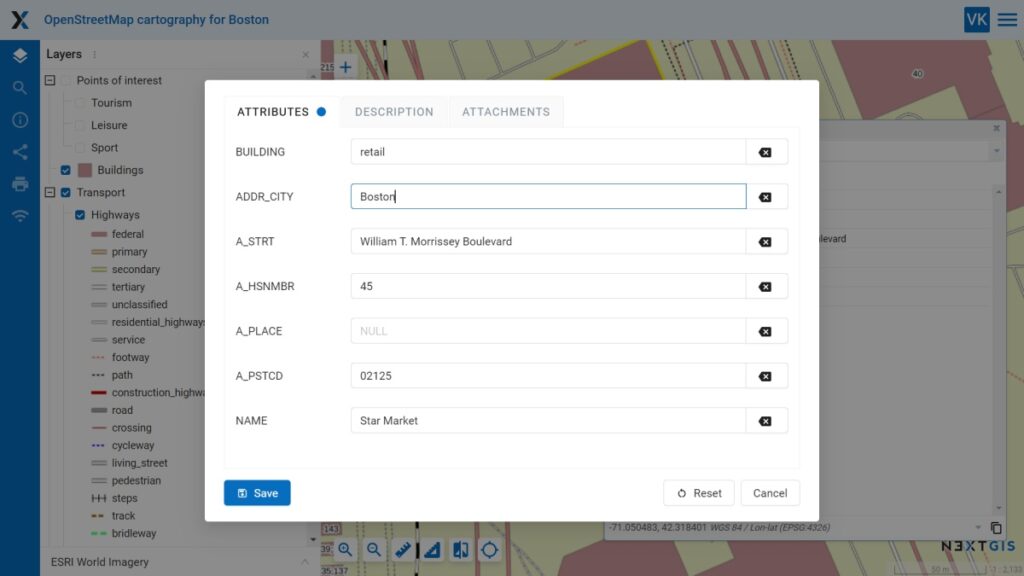
Open a pop-up feature edit window directly from the Web Map. Now you can use it to edit attribute values, descriptions, and attachments.
Modified tabs are marked with a blue dot. “Reset” button cancels the changes. After saving, the edited layer is immediately updated everywhere.
You can open this editing window from:
— Identification pop-up (pencil icon)
— Feature table (select a feature, then press Edit)
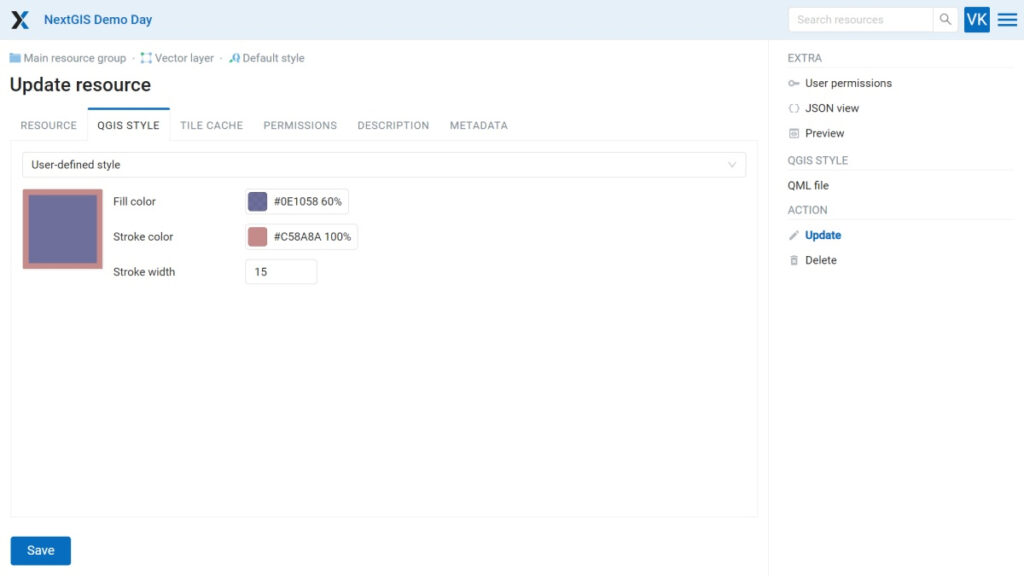
After creating or uploading a vector layer in NextGIS Web, you can create and customize a basic style for it. You can define the color and transparency of the outline and fill, as well as the line width.
Here are the steps to create and edit a style for a layer in NextGIS Web:
1. Go to the layer and create a new style for it or default style.
2. To customize the style enter the edit mode, go to the “QGIS Style” tab and select “User-defined style”.
3. Now you can modify the style’s appearance.
You can now connect Google Analytics yourself in the Web GIS settings.
In the Control Panel go to Metrics and Analytics and add the Measurement ID for Google Analytics.
In the “User Permissions” tab, you can now view all permissions for this resource for any user.