Species occurrence records are everywhere. Getting them out of web portals and into your GIS has always been the friction point. NextGIS Toolbox offers two tools to solve this problem.
Key Takeaways:
GBIF and iNaturalist are not interchangeable, and the choice between them changes what you get.
GBIF (Global Biodiversity Information Facility) is an intergovernmental data infrastructure that aggregates occurrence records from over 2,500 institutions worldwide – natural history museums, herbaria, university collections, research stations, and citizen science platforms including iNaturalist. Its collection spans several centuries: the oldest records are 18th-century museum specimens; the newest arrived this week. If you need the most complete picture of a species’ documented range across time, GBIF is the right starting point.
iNaturalist is a citizen science platform where naturalists photograph and log wildlife sightings. An observation reaches Research Grade once the community agrees on the identification – typically two or more agreeing IDs from other users. Research-grade observations are shared with GBIF on a weekly basis, but using the iNaturalist tool directly gives you fresher data, photo documentation on every record, and granular quality filtering unavailable through GBIF.
The key relationship: iNaturalist data flows into GBIF, making GBIF a superset. However, not all iNaturalist data is uploaded into GBIF, so choosing between the tools is not a question of better or worse – it is a question of what kind of evidence you need.
The following table compares the two data sources and the NextGIS tools available for data processing.
| GBIF | iNaturalist | |
| Data sources | 2,500+ institutions: museums, herbaria, research stations, citizen science (incl. iNaturalist) | Community naturalists on the iNaturalist platform |
| Historical depth | Centuries of records, including specimens and fossils | Primarily post-2010 |
| Record types | Observations, preserved specimens, fossils, living specimens | Observations only |
| Photo requirement | Optional filter | All research-grade records have photos |
Reach for GBIF when you need historical range data, institutional specimen records, records predating citizen science platforms, or a query spanning multiple data types and institutions.
Reach for iNaturalist when you need recent, photo-verified sightings, want to filter by community verification quality, or are monitoring a species that the citizen science community actively documents.
NextGIS Toolbox is a growing collection of browser-based geoprocessing tools. There is nothing to install – each tool runs in the cloud, takes a form input, and returns a result you can download and open in QGIS or any GIS that reads GeoPackage. The collection covers format conversion, satellite imagery acquisition, terrain analysis, and now direct access to the two largest open biodiversity data repositories in the world.
Toolbox is free to use with a NextGIS account. Each tool is also available via the Toolbox API, with Python SDK examples and raw HTTP examples on every tool page.
The tool queries the public GBIF API and returns matching records as a GeoPackage point layer named occurrences. Hard limit: 10,000 records per run.
Inputs:
Outputs: GeoPackage (point layer occurrences), report, JSON.
Pro Tip: After running any Toolbox tool, you can use the “Re-run” button to view and adjust any parameters without re-entering them – useful for narrowing a query that returns more records than expected, or comparing results across date ranges.
The tool queries the public iNaturalist API and returns matching records as a GeoPackage point layer named observations. Hard limit: 10,000 records per run.
Inputs:
Outputs: GeoPackage (point layer observations), report, JSON.
Each record in the output includes taxon name and rank, observation date and time, observer, quality grade, positional accuracy, license code, and the iNaturalist observation URI.
Deep Dive: Mapping the Return of the European Wolf in Germany
The European wolf (Canis lupus) in Germany illustrates what these two datasets – and tools – actually do differently.
Wolves were effectively absent from Germany for roughly 150 years before a pair from Poland established the first pack in Saxony in 2000. The population has since spread westward – from Brandenburg and Lusatia into Lower Saxony, Saxony-Anhalt, and Bavaria – in a pattern that is geographically legible on a map.
If we run the GBIF tool with no date filter (country code DE, taxon Canis lupus, Kingdom Animalia), we will see the full historical record – pre-20th-century museum specimens showing the original range across Germany, followed by a visible absence, followed by modern field observations documenting the recovery. The dated gap in the data is as informative as the records themselves.
One way to visualize the dynamics is to style the layer using a graduated color ramp based on the year of observation: Symbology → Graduated → expression year(“eventDate”) → sequential color ramp (YlOrRd or Blues) → Natural Breaks, 5 classes → Classify. This produces a single map where color encodes time – older records in lighter tones, recent records in the vivid end – without requiring multiple layers.
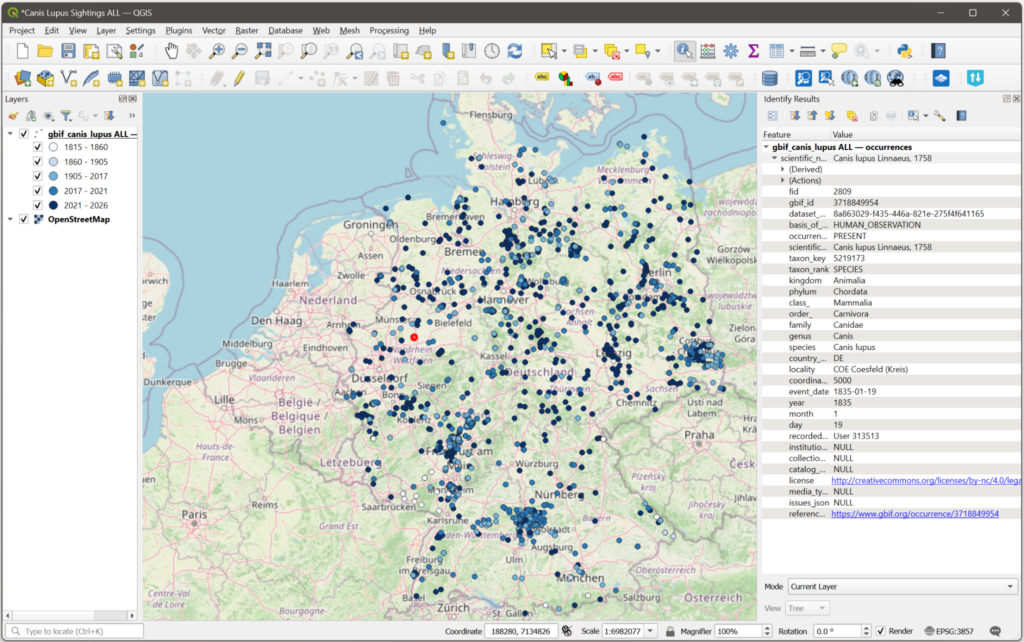
European wolf sightings in 1835-2026 (GBIF) with an example of a GBIF record for one sighting
Alternatively, you can run two separate queries – one for 2010 (only two records) and one for a more recent year. The contrast between the two maps makes the population growth concrete.
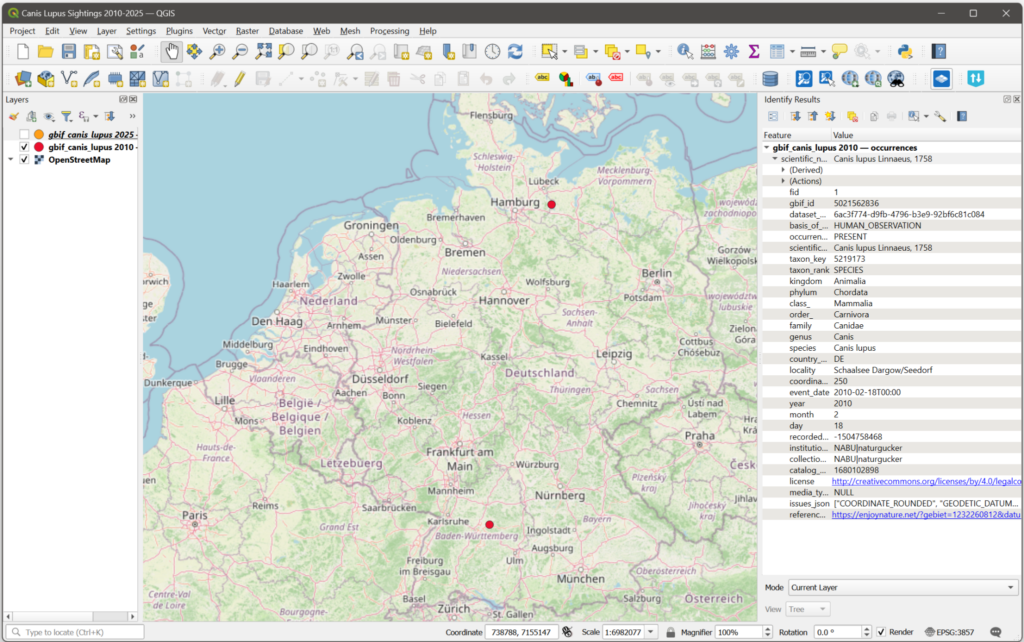 European wolf sightings in 2010 (GBIF) | 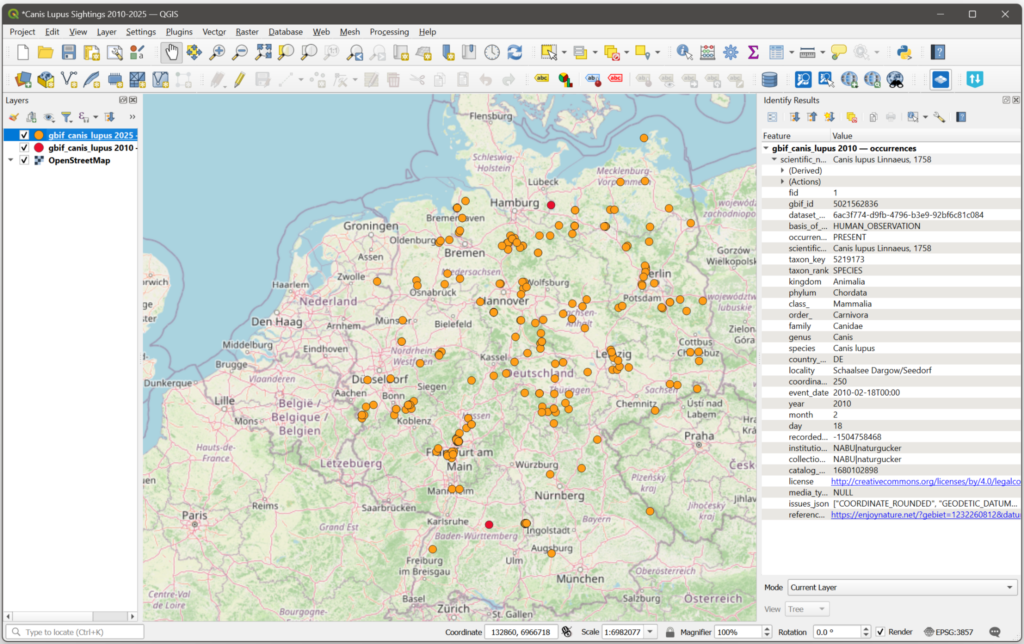 European wolf sightings in 2025 (GBIF) |
To see what iNaturalist data can offer, run the iNaturalist tool setting the bounding box around Germany and selecting Research Grade and Only wild. The result is a different view of the same species: community-verified sightings with photo documentation.
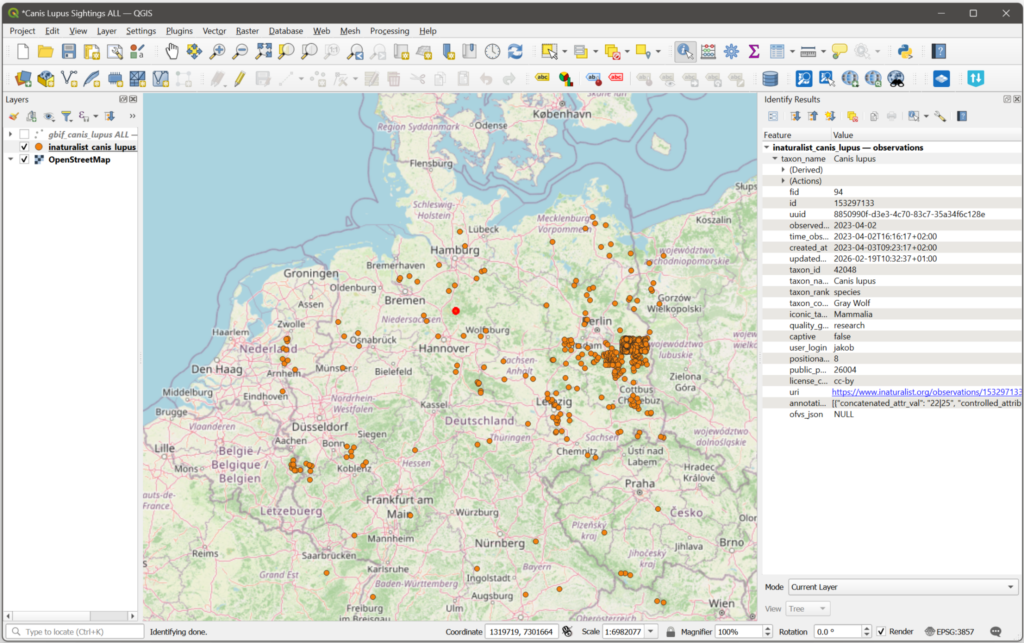
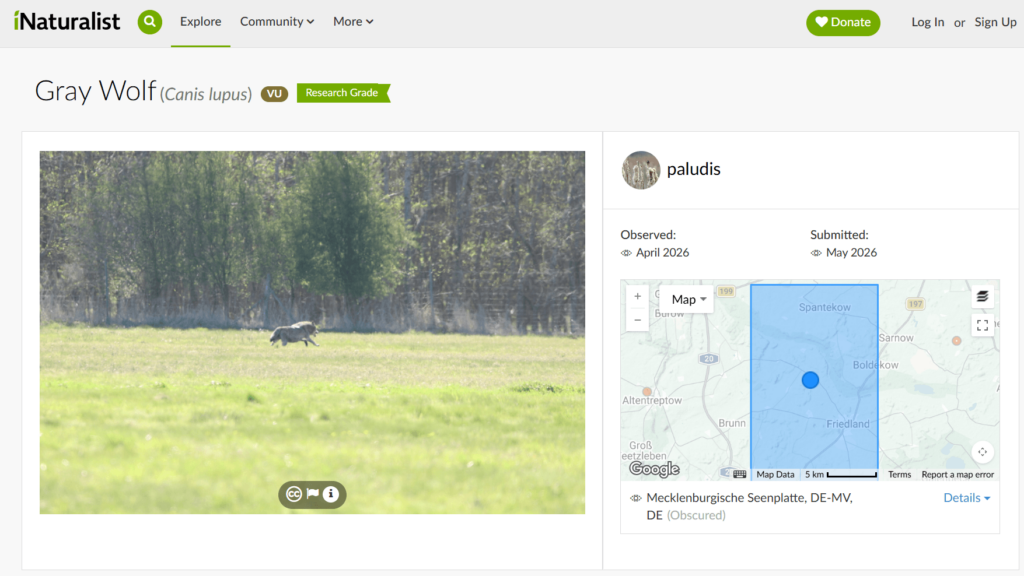
European wolf observations from the earliest available record through 2026 (iNaturalist) with an example of an iNaturalist record for one observation
Overlaying both layers in QGIS – iNaturalist as orange dots and GBIF as blue dots on top – shows the two sources in relation to each other. The next section answers the question why many orange dots are not covered by corresponding blue dots.
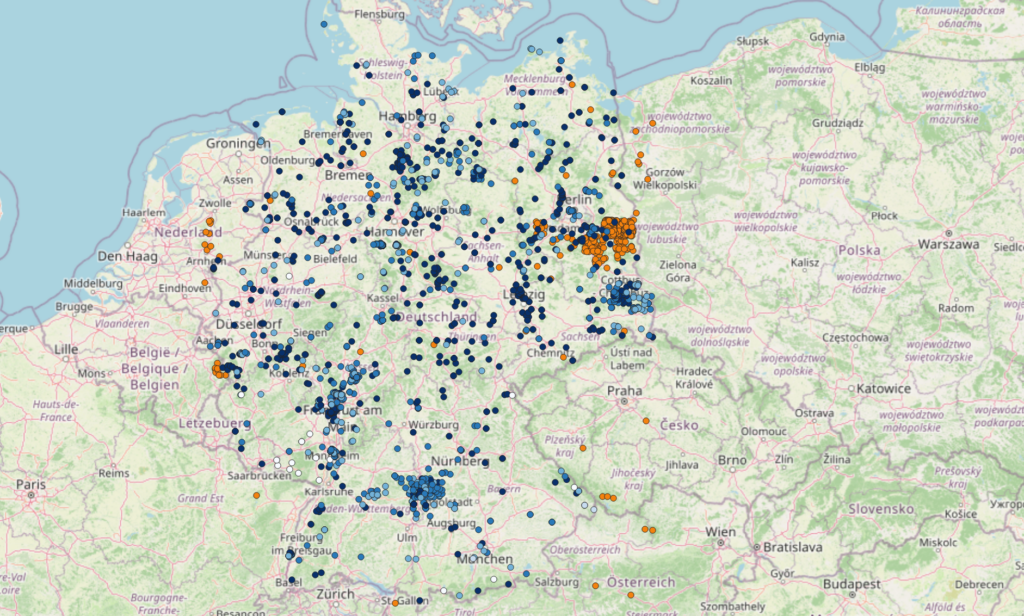
All available European wolf observations recorded by GBIF (color-graded blue) vs. iNaturalist (orange)
Downloading occurrence data is the easy part. The harder part is knowing what you’re looking at once it lands in QGIS. The following covers the most common sources of confusion when working with iNaturalist and GBIF data side by side.
iNaturalist outputs include two accuracy fields that serve different purposes.
positional_accuracy is the GPS precision of the original observation in meters – a measure of device accuracy at the moment of recording. A value of 8 means the observer’s GPS reading was accurate to within 8 meters. This reflects the quality of the observation equipment, not anything about how the coordinate is shared.
public_positional_accuracy is the accuracy of the coordinate that is actually exposed publicly. For most observations these two values are the same. For obscured observations, public_positional_accuracy is set to the diagonal of a 0.2° × 0.2° grid cell – an uncertainty radius of roughly 25–30 km depending on latitude. When you see a very large value in this field, the point on your map is randomized within that cell, not the true location.
In practice: check public_positional_accuracy before drawing conclusions from point positions. Small values (under a few hundred meters) mean you can trust the coordinate. Large values (tens of thousands of meters) mean the point shown is somewhere within a cell roughly the size of a small island, and spatial analysis at local scale is not meaningful for that record.
iNaturalist operates two separate geoprivacy systems:
Example of an obscured observation (iNaturalist)
For full documentation of how iNaturalist geoprivacy works, including how obscured and private settings differ and when restricted data is shared with the conservation community, see the iNaturalist geoprivacy help article.
GBIF handles sensitive species differently: coordinate generalization is delegated to the data publishers – individual museums, national agencies, and dataset curators – rather than managed centrally. There is no universal sensitive species list at the GBIF level, and obscuring practices vary between publishers and countries. GBIF publishes best-practice guidance but does not enforce a standard.
Research Grade is necessary but not sufficient for a record to reach GBIF. The full pipeline requires the following:
The wolf cluster east of Berlin that appeared in iNaturalist but not in GBIF was caused by NULL values in the license_code field of those records – a licensing gap, not a timing or coordinate issue. This is worth checking whenever you notice records in one dataset that are absent from the other: filter the iNaturalist layer in QGIS on license_code IS NULL to identify unlicensed records before drawing conclusions about discrepancies.
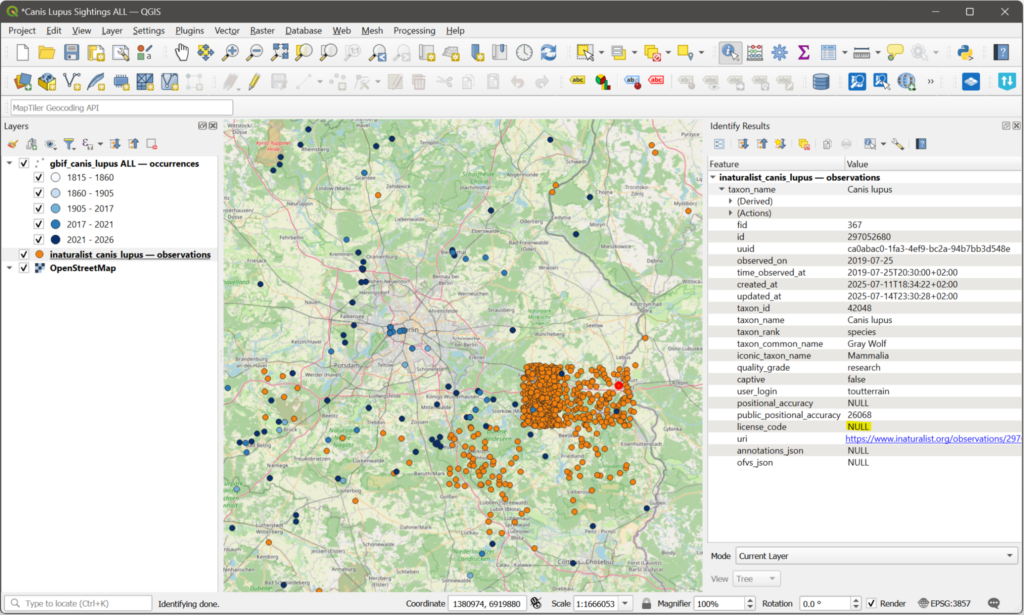
Most of the European wolf observations that were not submitted to GBIF had NULL values under license_code
If you are working with both datasets simultaneously and need to identify records that appear in both – for deduplication, validation, or combining attributes – the link is the iNaturalist observation ID. The id field in the iNaturalist output corresponds to the catalog_number field in the GBIF output for records that originated on iNaturalist. Joining on these fields in QGIS or a database allows you to match records across datasets and avoid double-counting species observations in combined analyses.
Pro Tip: If you would like to use the same dataset in other applications, NextGIS Toolbox provides tools that allow you to convert your vector layers into more than 80 formats, including CSV, XLSX, and ODS, and to perform the reverse operation – import your CSV, XLSX, or ODS file into a vector layer.
Do I need a GBIF or iNaturalist account to use these tools? No. Both tools query public APIs that do not require authentication. You need a free NextGIS account to access NextGIS Toolbox.
What format are the outputs in? Both tools produce a GeoPackage file – point layer occurrences for GBIF, observations for iNaturalist. GeoPackage opens natively in QGIS.
Can I query multiple species in one run? Not directly – both tools accept one taxon name per run. For multi-species projects, run the tool once per taxon and merge the resulting layers in QGIS using Vector → Data Management → Merge Vector Layers.
What does the 10,000-record limit mean in practice? For locally distributed or rare species, 10,000 is rarely a constraint. For common species over large areas, the ceiling is easy to reach. The tool report states how many records exist for your query. Work around the limit by narrowing the bounding box, tightening the date range, or filtering by country code (GBIF only).
Can I use these tools via API? Yes. NextGIS Toolbox exposes all tools via API. Each tool page includes a Python code tab with examples using the Toolbox SDK (pip install toolboxsdk), along with raw HTTP request examples for other environments.


