MOLUSCE – quick and convenient analysis of land cover changes

Important: MOLUSCE is for QGIS 2.x only. We don’t provide support for MOLUSCE.

Together with Asia Air Survey we’ve developed MOLUSCE (Modules for Land Use Change Simulations) – a new tool based on QGIS that allows to perform quick and convenient analysis of land cover changes.

A researcher who analyses changes in landscape through time often deals with questions like:

  • What are the changes and where did they happen?
  • Which factors can explain the changes and strong is their explanatory power?
  • What changes are expected in future and where?

The answer for the first question can be obtained by visual estimation, but to answer other questions one will need to set hypothises, verify them, derive conclusions and see how they meet the reality.

MOLUSCE is a toolbox to partially automate the process of answering such questions.

700px-Molusce-ANN

Briefly, the workflow consists of the following steps:

  1. Obtain landcover map for few time slices and  a set of potential explanatory variables;
  2. Calculate probabilities of transitions from class to class;
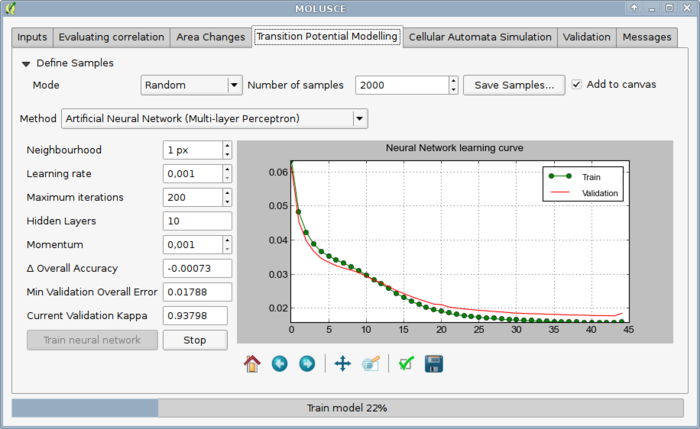
  3. Build a model using ANN, logistic regression, Weights of evidence or Multi-criteria evaluation to describe transitions based on factor variables;
  4. Use this model for forecasting;
  5. Validate the result with real data.

Find more information in GIS-Lab article (Russian, autotranslated).

125 responses to “MOLUSCE – quick and convenient analysis of land cover changes”

  1. Ana Paula Sousa R. Zaiatz says:

    Hello. My name is Ana.

    I’m working with maps of land use and land occupation. I’m trying to use the molusce but always appear errors saying that the geometry of the selected components do not match.

    Would you help me?

    Thank you very much in advance.

  2. idham says:

    There is a graph at above figure on x and y. I knew that x-ordinate showed iteration. How about y-ordinate?

  3. Claudia Figueiredo says:

    Hi,
    I am a PhD Student and I am working on land use and land cover changes. I am trying to use MOLUSCE plugin for the land-use simulation but I couldn’t find where to enter the exact year for which I am interested in predicting. It ask for initial and final year at the first step, but I am not sure for which year the simulated map is for.

    Thank you for your help.

    • Hi Claudia, target year is year_after + year_diff, where year_diff = year_after-year_before
      So if your data is for 2005 and 2010, than the prediction will be for 2015.

      • Claudia Figueiredo says:

        Hi Maxim, thanks for the answer.
        Just another question, at the windows ‘Cellular Automata Simulation’ we have the option ‘Number of Simulaton iterations’. It means if I put 1, it will be project into the future only once. For example, If the data is for 2005 and 2010, it will be project into 2015. In case I change the ‘Number of Simulation iterations’ to 2, it will be project into 2020???
        Thanks for your help and congrats for the plugin.

      • manik samanta says:

        Hi
        1 have a question
        1. which spatial variables does need for input in MOLUSCE in QGIS for predict LULC feature
        regards
        student

  4. Andre Santos says:

    Hi,
    I would like to use the MOLUSCE plugin to forecast land use. I am not sure if the plugin uses Monte Carlo Cellular Automata, CA Markov Chain, or only Cellular Automata aproach to to forecast land use.
    Could you please just clarify which approach is used to predict? If it uses Monte Carlo simulation, how many iteration is used?

    Regards,
    Andre Santos

    • Dmitry Kolesov says:

      Hi Andre,
      thank you for the important question.

      MOLUSCE realization is cellular-like approach, but it isn’t classic cellular automata. Classic realizations of cellular automata are rule-based (e.g. “if current pixel is forest and at least six neighbours are pasture, then new state is pasture”). MOLUSCE realization does not use explicit user-defined rules; instead it uses models (such as ANN) that make prediction of the probabilities. (For example, an ANN takes states of the current pixel and it’s neighbourhood, then updates state of the pixel using information encoded in the neighbourhood pixels. All rules are implicit and received during the ANN fitting procedure.)

      So MOLUSCE uses the following simulation logic:

      For every transition class (for example forest -> pasture) perform steps 1-3.

      1. Find number of pixels that have to be changed (forest -> pasture). The count depends on transition probabilities.
      2. For every pixel calculate transition potential using trained model. The potential depends on the model, current state of the pixel and its neighbours.
      3. Find pixels with the highest transition potentials and change their state.

      • Andre Santos says:

        Hi Dmitry,

        Thank you very much for the detailed explanation.
        Can I conclude that the method use a combination of three approach (Markov transition probability, artificial neural network and Cellular automate) to predict future land use change?

        Regards

        • Dmitry Kolesov says:

          Hi Andre,

          Really I don’t know because terminology is quite ambiguous. I’m not sure that we using the same terms. So I can’t say simple ‘Yes’ or ‘No’, but I have to explain in more words. Sorry for the wordiness.

          Yes, you are right in general: MOLUSCE uses a combination of three approaches. But below are presented some details.

          The predictions/simulations are done using the next procedure:

          1. Get Transition Probabilities. Get two rasters (Init-State -> Final-State). For every pixel in Init-State-raster find corresponding pixel in Final-State-raster and update lookup table:

          ```````| Class1 | Class2 | ... | Class N
          -------+--------+--------+-----+--------
          Class1 | n_11 | n_12 | ... | n_1N
          .......| ... | ... | ... | ...
          Class N| n_N1 | n_N2 | ... | n_NN

          where n_ij is the number of pixels that changed their class (Class i -> Class j). Finally we can calculate frequencies using the counts and use the frequencies as the transition probabilities.

          2. Model Training. Second step trains a model for predicting the transitions between classes. This step doesn’t uses transition probabilities, it tries to find appropriate model for every transition Class i -> Class j. (The model uses user-defined predictors and window of user defined size). Initially the training procedure creates some random points for sampling. For example if the user gives 2 predictor (say, elevation and annual temperature) and uses 3×3 window, then the training procedure uses 27 dimensional vector of input variables for every sample: 9 neighbors in Init-State-raster + 9 neighbors in elevation raster + 9 neighbors in temperature raster and K output variables (we use dummy encoding for the transitions). Then we train a model to predict transition Class i -> Class j (molusce has 4 modes, not ANN only).

          3. The simulation procedure I described in the previous note.

          So finally:

          * The transition probabilities are Markovian because they are depend on current state only (state number L) and don’t depend on on previous states (L-1, L-2, …).
          * But the transitions Class i -> Class j depend on probabilities AND the predictors AND the current class of pixel AND the neighbors AND the trained model.

          In other words, if we define state of the system as the tuple
          STATE == (the current class of pixel, the neighbors, the predictors, the trained model),
          then we can say that the process in Markovian.

      • SALEEM AHMAD YATOO says:

        Can you please send me some papers on MOLUSCE which you have done or of others. I tried my best to find the research papers on this but did not found. So, can you send please.
        Thank you and Regards

  5. Sushil says:

    Hi
    I am trying to use molusce for land use prediction. For this I will have many explanatory variables/ factor maps like distance to road, distance to river, slope and land use type. So my question how should be the factor map be like? For example for distance to road and distance to river variables if their factor maps are merely rasters with distance values then how to indicate that distance close to road has more suitability for urban growth but on contrary suitability for urban growth increases with distance in case of distance to river.

    • This is not how it works. Transition probabilities are determined from land-cover data, you can’t assign probabilities yourself.

      • Sushil says:

        Hi
        Thank you for your kind response. I still have few questions regarding explanatory variables/factor maps:
        1. As i mentioned before i have many explanatory variables. I prepared all of them in the range of 0-1 ( 0 meaning low and 1 meaning highly suitable). For example for distance to road i obtained a raster representing distance to road then applied fuzzy membership with linear decreasing function (so that close region to road would get 1 and the value decreases linearly) in arcgis to obtain the range 0-1. Then i used it in molusce as factor map. I did similar to other factors as well obtaining 0-1 range. So is it the right way of preparing factor map or not. If not could you explain how should they be prepared

        2. Is it possible to impose constraint. For example i dont want certain reserved areas in my area of interest to undergo land use change in the simulated model.

  6. Mark says:

    Hi.
    I am trying to use MOLUSCE to model the land use change.
    When I tried to create changes map, the error showed up:

    AttributeError: ‘NoneType’ object has no attribute ‘save’

    Could you please tell me what is going on? I’m new to GIS…

    Best,
    Mark

    • Mark says:

      I solved the problem.
      Thank you

      • Laura Gutierrez says:

        Hi Mark
        How did you solve the problem? I am trying to run Molusce and the same error appears in the stage of “Automata cellular simulation”
        An error has occurred while executing Python code:
        AttributeError: ‘NoneType’ object has no attribute ‘SetProjection’
        Thank you in advance
        Best
        Laura

      • magda says:

        how to solve it mark, cause I meet a same problem with this “AttributeError: ‘NoneType’ object has no attribute ‘save’”

      • Bhaswati Roy says:

        Hi Mark. Did you solve this problem? I have same problem. Please help me.

      • aISWARYA says:

        how YOU SOLVED THE PROBLEM?

  7. Dear Sir/Madam,
    Thank you for your helpful plug-in. I have found, that in the manuals explanatory variables are discussed regardless the date of “output” and “input” data. But in case I have multitemporal explanatory rasters available for the same dates, as “input” and “output” rasters (for example, input and output rasters – land use from satellite imagery, explanatory variables – vegetation indices from the same imagery), should I use vegetation indices from “input” or “output” rasters?

  8. Teshome says:

    Dear MOLUSCE users
    I’ve been surprised when I knew this plugin, I was exhaustively struggling with IDRISI Selva to project the future land cover but ended without success.
    Now I’ve started using MOLUSCE to overcome my MSc thesis. Many thanks to MOLUSCE developers and providers for this much worthy plugin!!!
    ==> the problem I found in MOLUSCE is the time taken to complete “transitional potential modeling” part. my study area covers 11,500 km2 and I’m using landcover maps of 2010 & 2013 to validate 2016 with associated variables, like distance from road, distance from earlier disturbances, and DEM @ 30-meter resolutions. It takes a half of a day in training the neural network, then I stopped the process and reduced the resolutions of all input datasets to 120-meter and started the again. But still, the process is running for about 2 hours. Is that the correct way to go through?
    Thank You Very much!

  9. Eric says:

    am trying to run the tool and i get the following challenges
    does not calculate class statistics as well as transition matrix.
    and i also get the below error
    ValueError: operands could not be broadcast together with shapes (10,) (11,)
    Traceback (most recent call last):
    File “C:/Users/Ericoh/.qgis2/python/plugins\molusce\moluscedialog.py”, line 413, in updateStatisticsTableDone
    self.__drawTransitionStat()
    File “C:/Users/Ericoh/.qgis2/python/plugins\molusce\moluscedialog.py”, line 1027, in __drawTransitionStat
    stat = self.inputs[“crosstab”].getTransitionStat()
    File “C:/Users/Ericoh/.qgis2/python/plugins\molusce\algorithms\models\crosstabs\manager.py”, line 91, in getTransitionStat
    deltas = finalArea – initArea
    ValueError: operands could not be broadcast together with shapes (10,) (11,)

    • Hi Eric,
      please open issue here: https://github.com/nextgis/molusce/issues/
      don’t forget to add info about QGIS version, MOLUSCE version and fragment of test data if possible to reproduce the error.

    • You got that problem for the dimensions of the input rasters. They don’t have the sufficient information to do the transition matrix or any other procces, try make bigger your rasters, that works for me

    • febri says:

      Find the similar problem to this:
      ValueError: operands could not be broadcast together with shapes (47,) (53,)
      eventhough the raster used is in similar dimension (4329 cols, 4612 rows) and all are INT raster type and has only 1 band.
      Don’t know how to resolve the issue… Could you help? Thanks..
      QGIS version 2.18.20
      MOLUSCE version 3.0.13

  10. Evidence says:

    I just downloaded MOLUSCE plugin in QGIS 2.18.8 but the MOLUSCE is not working. What could be the problem? I would like to know how to resolve this problem and work with MOLUSCE. Thanks.

    • Hi. Please check if you’ve specified initial and final raster as well as spatial variables rasters. They should be compatible (press Check geometry)

      • Evidence says:

        Thank you. I specified the initial and final land use raster but i did not specify that of the spatial variable. I will do that and see how it goes. hope to get back to you. Thanks once again

  11. Dipak says:

    Hi..
    I am using MOLUSCE in QGIS 2.6.1 for a land use prediction. I did a subset of my dataset and only took ‘dist_road’ and ‘dist_river’ as the factor along with lulc data for the year 1992 and 2000 for a learning purpose. The tool is running successfully but there is no change in the prediction. For example, my simulated/predicted lulc map is equal to my final map i.e lulc map of the year 2000. However, It is expected to change after prediction with iteration 1. The tool is user-friendly and I am enjoying it. Any probable answer to the above mention issue will be highly appreciated.
    Dipak

    • Dipak says:

      In connection to the above question, I want to know how the attributes of factor variable are taken into account while inputting to the MOLUSCE. For example, in case distance from river/road, whether we have to reclassify (value may vary from 1 t0 10) the raster or take the distance raster (value may vary from 0 to 10000) as the model input. Is there any example datasets available to run the MOLUSCE model which will give a better insight to many new users.

    • Yutthana says:

      My simulation result is the same with you

  12. Susan says:

    Hi, My name is Susan.

    Please how to I calculate distance to road, DEM, water or other spatial variables using qgis before i use the molusce plugin for my prediction

    Thanks

  13. Yutthana says:

    Hello, please recommend me to solve the simulation result is no change.
    – landuse (2007 initial, 2016 final)
    – spatial variable (dist_road) >> reclassify (1,2,3,4,5)
    – Transition Modeling (ANN) >> Neightbourhood = 1 px, Learing rate = 0.5, Maximum iteration = 100, Hidden layer 2
    ## The simulation resut (lu 2025) in final step show the same output as landuse (2016)
    what is happen in the process?
    thank you
    yuth

    • Aziza says:

      We have the same problem here. I hope someone would explain why and give solution

  14. Ingrid says:

    Hi, I’m trying to predict land cover change and I am using 2 landsat images from 2014 and 2017. My spatial variables are distance to roads and distance to rivers which I obtained using euclidean distance and reclassified them into 3 classes with the values; 1,4 and 9. My geometry checked out however, I’ve failed to create a changes map. Please help!

  15. Carlos Weiss says:

    Hi,
    Firstly, thank you for this very helpful plug-in. I would like to know whether this plugin deals with stochastic events. I used the ANN model to make prediction of probabilities but I am not sure how this sort of modelling deals with stochastic events.
    Regards
    Carlos

  16. Judá García says:

    Once again me… This time appears this message:
    warning:/home/miguel/.qgis2/python/plugins/molusce/algorithms/models/crosstabs/model.py:86: FutureWarning: comparison to `None` will result in an elementwise object comparison in the future.
    if self._T == None:
    traceback: File “/home/miguel/.qgis2/python/plugins/molusce/molusce.py”, line 111, in run
    d.exec_()
    File “/home/miguel/.qgis2/python/plugins/molusce/algorithms/models/crosstabs/manager.py”, line 48, in __crosstableFinished
    self.crossTableFinished.emit()
    File “/home/miguel/.qgis2/python/plugins/molusce/moluscedialog.py”, line 444, in updateStatisticsTableDone
    self.__drawTransitionStat()
    File “/home/miguel/.qgis2/python/plugins/molusce/moluscedialog.py”, line 1058, in __drawTransitionStat
    stat = self.inputs[“crosstab”].getTransitionStat()
    File “/home/miguel/.qgis2/python/plugins/molusce/algorithms/models/crosstabs/manager.py”, line 79, in getTransitionStat
    initArea = tab.getSumRows()
    File “/home/miguel/.qgis2/python/plugins/molusce/algorithms/models/crosstabs/model.py”, line 125, in getSumRows
    crosstable = self.getCrosstable()

    I checked my rasters and take away “Non Data” pixels, but continues showing the message. I’m f ### g desperate about this.
    Any help?
    Thanks

  17. Jomehzadeh says:

    Hi there!
    Every time I try to run MOLUSCE in QGIS version “2.18.14” on Windows 10, I face this error message:
    “Traceback (most recent call last):
    File “C:/Users/Jomehzadeh/.qgis2/python/plugins\molusce\molusce.py”, line 109, in run
    d = moluscedialog.MolusceDialog(self.iface)
    File “C:/Users/Jomehzadeh/.qgis2/python/plugins\molusce\moluscedialog.py”, line 110, in __init__
    self.grpSampling.setSettings(self.settings)
    TypeError: QgsCollapsibleGroupBox.setSettings(QgsSettings): argument 1 has unexpected type ‘QSettings'”
    I appreciate any help!
    Best regards!

  18. Amaladas.P says:

    hi, i installed Qgis 2.14.19 , inside plugin window i search MOLUSCE, but MOLUSCE is not available! please tell me how solve this problem?

  19. jeenu says:

    I want to use molusce fo prediction .but how can I download iyt

  20. ahsan says:

    I am using Molusce. Kindly help me in creating Spatial variable.

  21. Amaladas.P says:

    hai Maxim Dubinin, i updated QGIS version 3.0.1-Girona, i searching MOLUSCE but not available why? ( i was read one web commant / suggesion they are telling computer name is don’t use numerical letter ex. Geo1) my computer name is also GIS1, may be this is issue ?

  22. pegah says:

    Hi Maxim Dubinin
    Is it possible to integrate MOLUSCE with future climate projections datasets to predict future LULC projection?
    thank you in advance.

  23. Márcia Rodrigues de Moura Márcia Fernandes says:

    Good afternoon, I’m using the molusce plugin and on the transition potential modeling tab the rendering is taking over 12 hours. That’s right?

  24. Majid Azari says:

    Hi Maxim Dubinin,
    Are there any papers or journals that have used MOLUSCE, I am looking for papers for my literature review but I cant find any. Could you please direct me to some papers?

  25. Majid Azari says:

    Hi Maxim Dubinin,
    I am getting an error after runnng the Cellular automata simulation, it says:
    An error has occurred while executing python code:
    AttributeError: ‘NoneType’ object has no attribute ‘color”

    can you please explain what this error means and how to solve it?

    • caroline says:

      Hi Majid! By any chance, did you find the solution to this issue? I am having the exact same error and can‘t seem to find a way to work around it.
      Best regards,
      Caroline

  26. Osvaldo says:

    Hi!
    I’ve been using MOLUSCE for a while now and I just realized there is no plugin available for the new version of QGIS. Area you planning to launch a new plugin version soon?
    Cheers,

  27. ilyas says:

    Hi, may i ask how to cite this plug-in ?
    all of the studies i read only stated that this plugin is made by Asia air, but nothing found in the references..

    Thank you

  28. Thais Issii says:

    Hi!
    I tried to create the changes map on Molusce, but I couldn’t.
    I want to use just maps of land use and cover. Is that possible?
    Can I create the changes map without a explanatory factor?

  29. Azin says:

    hi
    i recived a message after instal in qgis 2.18
    : This plugin is broken
    DLL load failed: The specified module could not be found.
    please help me .

  30. Azin says:

    hello
    1-how can i use 3 or 4 period of a Urban to train Ann? for example 1980,1990 , 2000, 2010 then Validate with 2018 .
    2-how can i select the epoch or epochs to simulate ?
    for example Molusce determine simulate map of 2020,2030,2040,2050
    3- wich time molusce simulate for me ?
    Best regards

  31. Neha Midha says:

    Would really be great, if you could help.
    Error “Crash Dump” in Molusce Plugin during “Change Map” creation.
    I have used 2 LULC maps (1999, 2008) as input and 1 “distance to road” spatial variable.

  32. M h Kalubarme says:

    Dear Sir,
    We are working Land use /land use cover monitoring using 20 years Landsat data of 1997 and 2017.
    We are using the molusce for land use forecast. We are getting kappa values of 0.7356. We want your suggestion how to interpret the these results and whether this kappa value is significant for forecasting the future land use change.
    Regards

  33. SOUMEN GHOSH says:

    AttributeError: ‘NoneType’ object has no attribute ‘color’
    Traceback (most recent call last):
    File “C:/Users/SOURAV & SOUMEN/.qgis2/python/plugins\molusce\moluscedialog.py”, line 573, in simulationDone
    colorRamp = self.calcCertancyColorRamp(layer)
    File “C:/Users/SOURAV & SOUMEN/.qgis2/python/plugins\molusce\moluscedialog.py”, line 1391, in calcCertancyColorRamp
    entryColors.append(colorRamp.color(float(i) / float(numberOfEntries)))
    AttributeError: ‘NoneType’ object has no attribute ‘color’

    Python version: 2.7.5 (default, May 15 2013, 22:44:16) [MSC v.1500 64 bit (AMD64)]
    QGIS version: 2.18.16 Las Palmas, d473c3071a
    Python Path:
    C:/PROGRA~1/QGIS2~1.18/apps/qgis/./python/plugins\processing
    C:/PROGRA~1/QGIS2~1.18/apps/qgis/./python
    C:/Users/SOURAV & SOUMEN/.qgis2/python
    C:/Users/SOURAV & SOUMEN/.qgis2/python/plugins
    C:/PROGRA~1/QGIS2~1.18/apps/qgis/./python/plugins
    C:\Program Files\Hexagon\ERDAS IMAGINE 2015\usr\lib\Win32Release\python
    C:\PROGRA~1\QGIS2~1.18\bin\python27.zip
    C:\PROGRA~1\QGIS2~1.18\apps\Python27\DLLs
    C:\PROGRA~1\QGIS2~1.18\apps\Python27\lib
    C:\PROGRA~1\QGIS2~1.18\apps\Python27\lib\plat-win
    C:\PROGRA~1\QGIS2~1.18\apps\Python27\lib\lib-tk
    C:\PROGRA~1\QGIS2~1.18\bin
    C:\PROGRA~1\QGIS2~1.18\apps\Python27
    C:\PROGRA~1\QGIS2~1.18\apps\Python27\lib\site-packages
    C:\PROGRA~1\QGIS2~1.18\apps\Python27\lib\site-packages\jinja2-2.7.2-py2.7.egg
    C:\PROGRA~1\QGIS2~1.18\apps\Python27\lib\site-packages\markupsafe-0.23-py2.7-win-amd64.egg
    C:\PROGRA~1\QGIS2~1.18\apps\Python27\lib\site-packages\win32
    C:\PROGRA~1\QGIS2~1.18\apps\Python27\lib\site-packages\win32\lib
    C:\PROGRA~1\QGIS2~1.18\apps\Python27\lib\site-packages\Pythonwin
    C:\PROGRA~1\QGIS2~1.18\apps\Python27\lib\site-packages\Shapely-1.2.18-py2.7-win-amd64.egg
    C:\PROGRA~1\QGIS2~1.18\apps\Python27\lib\site-packages\wx-2.8-msw-unicode
    C:\PROGRA~1\QGIS2~1.18\apps\Python27\lib\site-packages\xlrd-0.9.2-py2.7.egg
    C:\PROGRA~1\QGIS2~1.18\apps\Python27\lib\site-packages\xlwt-0.7.5-py2.7.egg
    C:/Users/SOURAV & SOUMEN/.qgis2//python

    • caroline says:

      Hi Soumen! By any chance, did you find the solution to this issue? I am having the exact same error and can‘t seem to find a way to work around it.
      Best regards,
      Caroline

  34. Fernando Chavira says:

    Hello, I have a question.
    When the area change tables are calculated. In the table of class statitics, what is MOLUSCE based on to calculate the percentage of increase in area?
    For example in 2010 I have built area of 187 sq. km and in 2017 I have 324 sq.m. km., this means that it grew 73% but the table indicates 2.07%. This is what I do not understand.

  35. Ismail Rashad says:

    Hello, i have a question
    When i simulate something with ANN, sometimes the result will be the same with other iteration, like first iteration and second iteration would peoduce the same result,and then it ignores pattern that’s been calculated in change map, the example is the trend of one class should be decreasing every year but, when i simulate it, it increases the areas that’s should be decreasing according to pattern.. Do you know why this roblem occurs?

    Thank You

  36. DEA CAROLINA THIEME ARAUJO says:

    Hi, i am trying to install the MOLUSCE pluggin in my 2.18.28 QGIS version, but when it´s finished shows me the message “Broken pluggin”.
    Can anyone help me?

    • DEA CAROLINA THIEME ARAUJO says:

      This is the Message Error:
      Este complemento está quebrado
      Non-ASCII character ‘\xe2’ in file C:\PROGRA~1\QGIS2~1.18\apps\Python27\lib\site-packages\scipy\stats\_continuous_distns.py on line 3346, but no encoding declared; see http://python.org/dev/peps/pep-0263/ for details

  37. Stavros Patsalidis says:

    Hello to everyone,
    This is a very useful tool great work ! I have some questions though you may be able to help.
    1) What does certancy function (Certancy map) created represents ? The probability of the simulated prediction in each pixel being true ?
    2) And about the evaluation of correlation of explanatory factors, what we have is the evaluation of correlation between the factors we set correct? So if we see that a variable has low correlation we throw it out of the model ! But how do we evaluate the correlation of the variables we choose with the land cover change (i.e. if this variable affects the land cover change)?

    Thanks in advance

    • Shantanu says:

      Hey What is your QGIS version? I would like to know. I’ve got one task to perform with this tool but struggling with QGIS version

  38. Kumaresh says:

    I am trying to use molusce for the first time I am having initial and final image but unable give spatial variables even if I add vector file in layer it is not snowing in inputs please help me

  39. Felipe Garrido says:

    Hello, I have used this model for a thesis im working on. How should I cite the company? Is there a paper or something like that to use as a reference?

  40. GEBREYOHANNES ABRHA says:

    while i was doing the area change calculation using molusce the class color appeared with no color. would you please help me how to make appear this class color for each category?

    • abhi says:

      define colors in Input raster files. the same color you will get in the area change table or in the transition matrix

  41. Héctor Sánchez says:

    Hi.
    My name is Héctor.
    When trying to generate the areas of cmabio, I generate this error. How can I correct it?

    ValueError: The truth value of an array with more than one element is ambiguous. Use a.any() or a.all()
    Traceback (most recent call last):
    File “C:/Users/User/.qgis2/python/plugins\molusce\moluscedialog.py”, line 444, in updateStatisticsTableDone
    self.__drawTransitionStat()
    File “C:/Users/User/.qgis2/python/plugins\molusce\moluscedialog.py”, line 1058, in __drawTransitionStat
    stat = self.inputs[“crosstab”].getTransitionStat()
    File “C:/Users/User/.qgis2/python/plugins\molusce\algorithms\models\crosstabs\manager.py”, line 79, in getTransitionStat
    initArea = tab.getSumRows()
    File “C:/Users/User/.qgis2/python/plugins\molusce\algorithms\models\crosstabs\model.py”, line 125, in getSumRows
    crosstable = self.getCrosstable()
    File “C:/Users/User/.qgis2/python/plugins\molusce\algorithms\models\crosstabs\model.py”, line 86, in getCrosstable
    if self._T == None:
    ValueError: The truth value of an array with more than one element is ambiguous. Use a.any() or a.all()

    Versión de Python: 2.7.14 (v2.7.14:84471935ed, Sep 16 2017, 20:25:58) [MSC v.1500 64 bit (AMD64)]
    Versión de QGIS: 2.18.28 Las Palmas, aa30730ac6

    Ruta de Python:
    C:/PROGRA~1/QGIS2~1.18/apps/qgis-ltr/./python/plugins\processing
    C:/PROGRA~1/QGIS2~1.18/apps/qgis-ltr/./python
    C:/Users/User/.qgis2/python
    C:/Users/User/.qgis2/python/plugins
    C:/PROGRA~1/QGIS2~1.18/apps/qgis-ltr/./python/plugins
    C:\PROGRA~1\QGIS2~1.18\bin\python27.zip
    C:\PCI Geomatics\Geomatica 2018\exe
    C:\PROGRA~1\QGIS2~1.18\apps\Python27\DLLs
    C:\PROGRA~1\QGIS2~1.18\apps\Python27\lib
    C:\PROGRA~1\QGIS2~1.18\apps\Python27\lib\plat-win
    C:\PROGRA~1\QGIS2~1.18\apps\Python27\lib\lib-tk
    C:\PROGRA~1\QGIS2~1.18\bin
    C:\PROGRA~1\QGIS2~1.18\apps\Python27
    C:\PROGRA~1\QGIS2~1.18\apps\Python27\lib\site-packages
    C:\PROGRA~1\QGIS2~1.18\apps\Python27\lib\site-packages\jinja2-2.7.2-py2.7.egg
    C:\PROGRA~1\QGIS2~1.18\apps\Python27\lib\site-packages\markupsafe-0.23-py2.7-win-amd64.egg
    C:\PROGRA~1\QGIS2~1.18\apps\Python27\lib\site-packages\win32
    C:\PROGRA~1\QGIS2~1.18\apps\Python27\lib\site-packages\win32\lib
    C:\PROGRA~1\QGIS2~1.18\apps\Python27\lib\site-packages\Pythonwin
    C:\PROGRA~1\QGIS2~1.18\apps\Python27\lib\site-packages\Shapely-1.2.18-py2.7-win-amd64.egg
    C:\PROGRA~1\QGIS2~1.18\apps\Python27\lib\site-packages\wx-2.8-msw-unicode
    C:\PROGRA~1\QGIS2~1.18\apps\Python27\lib\site-packages\xlrd-0.9.2-py2.7.egg
    C:\PROGRA~1\QGIS2~1.18\apps\Python27\lib\site-packages\xlwt-0.7.5-py2.7.egg
    C:/Users/User/.qgis2//python

    • Mikaela says:

      Hi! Did you find a solution for this? I have the same problem and can’t move on. Please share what you have done. Thank you!

    • Agnes Liji George says:

      I am facing the same problem. Can you tell me how u have solved this error?

    • chriss lewis says:

      did you get the solution to this? HELP

  42. Sijan Bhandari says:

    Maxim Dubinin ,I am doing my Bachelor project thesis on LULC Analysis due to River Course change what may be the spatial variables i have to put into the MOLUSCE during mypredication using Cellular Automata Simulation?

  43. Ruben says:

    I am trying to run Molusce and following error occurs in the stage of “Automata cellular simulation”:
    An error has occurred while executing Python code:
    AttributeError: ‘NoneType’ object has no attribute ‘SetProjection’

    Any idea why? Help is much appreciated!

  44. joseph says:

    Hey did you get solution to this?

  45. Mariana JV says:

    Hello NEXTGIS. Thank you for the MOLUSCE introduction.
    I have many questions about the tool.
    1. If I put in 2 raster layers with only one year of differnce, as my reference years, my result or prediction would be as a year?
    2. The predict method depends of what? I mean… Depends of the cober use (urban-rural)? Or is just something in the process?
    3. What kind of spatial variables do I have to use? Can I use environmental o climate variables that explains my changes? Is that type of variables?

    Thank you for the support!

    Best regards,
    Mariana

  46. Hafez Ahmad says:

    I am trying to install it in qgis3.01 but getting
    This plugin is broken Error reading metadata: general
    any solution

  47. Mariana JV says:

    I think MOLUSCE is not available in QGIS 3.x version. You must try in 2.x version.
    Hope this would be helpfull!

  48. Quang says:

    hi Maxim,
    I am Quang, I have got a problem for running step “Simulation result”, it said ‘NoneType’ object has no attribute ‘readSymbology’ in molusceutils.py.
    I ran on Mac OS Sierra. Please give me some advice and support me!
    Thank you so much.
    Cheers,
    Quang
    Errors detail:
    File “/Users/admin/.qgis2/python/plugins/molusce/moluscedialog.py”, line 594, in simulationDone
    if utils.copySymbology(utils.getLayerByName(self.leInitRasterName.text()), utils.getLayerByName(QFileInfo(self.leMonteCarloPath.text()).baseName())):
    File “/Users/admin/.qgis2/python/plugins/molusce/molusceutils.py”, line 206, in copySymbology if not dst.readSymbology(root, errMsg):
    AttributeError: ‘NoneType’ object has no attribute ‘readSymbology’

  49. kabore says:

    Hi, I tried to use Molusce. The tool is running successfully but there is no change in the prediction image. The prediction image at the end, is equal to my lulc last year image. Could you help me please?

  50. Manikandan says:

    It’s possible to use stream order instead of road distance