NextGIS and Amur Branch of WWF Russia created a system that uses remote sensing and machine learning to detect forest logging areas. Illegal logging or logging performed with violation of the forest law are ubiquitous throughout Russian Far East and operational monitoring information is at premium both for government agencies and for environmental NGOs.
The main functional requirements for the system are:
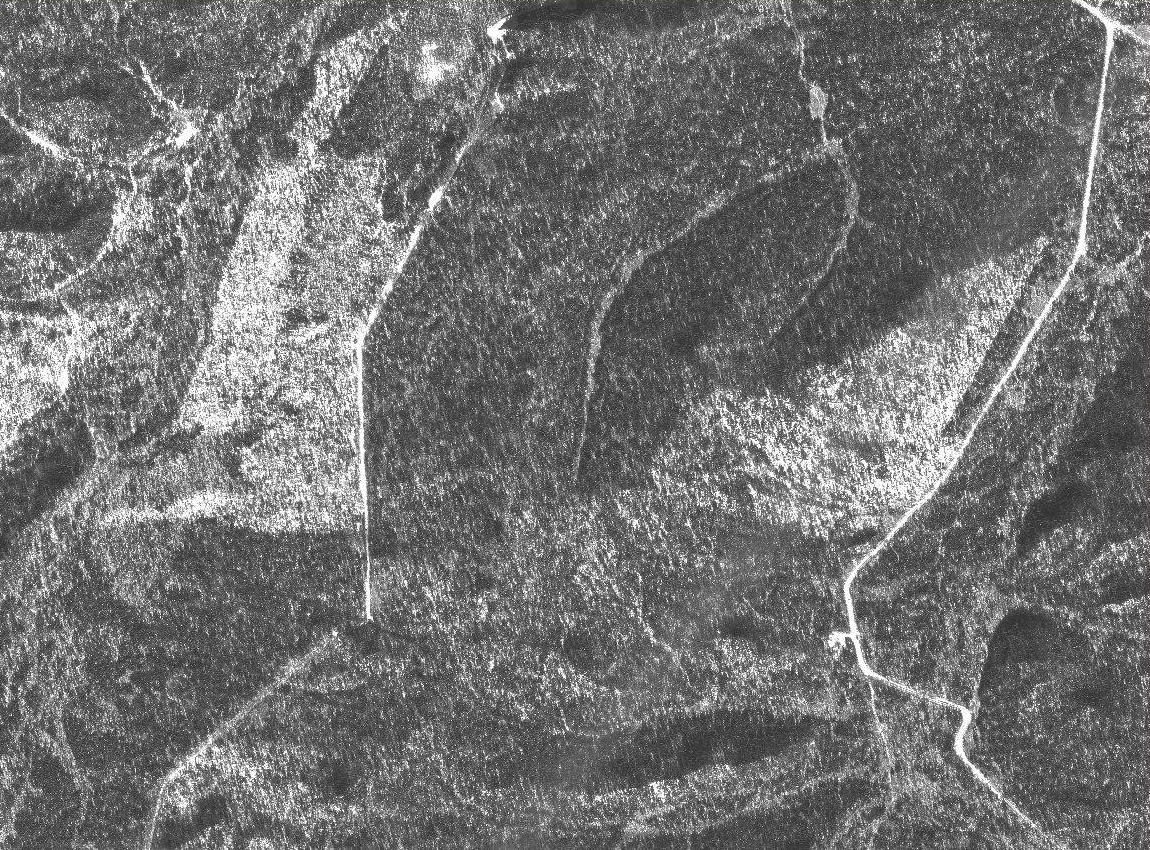
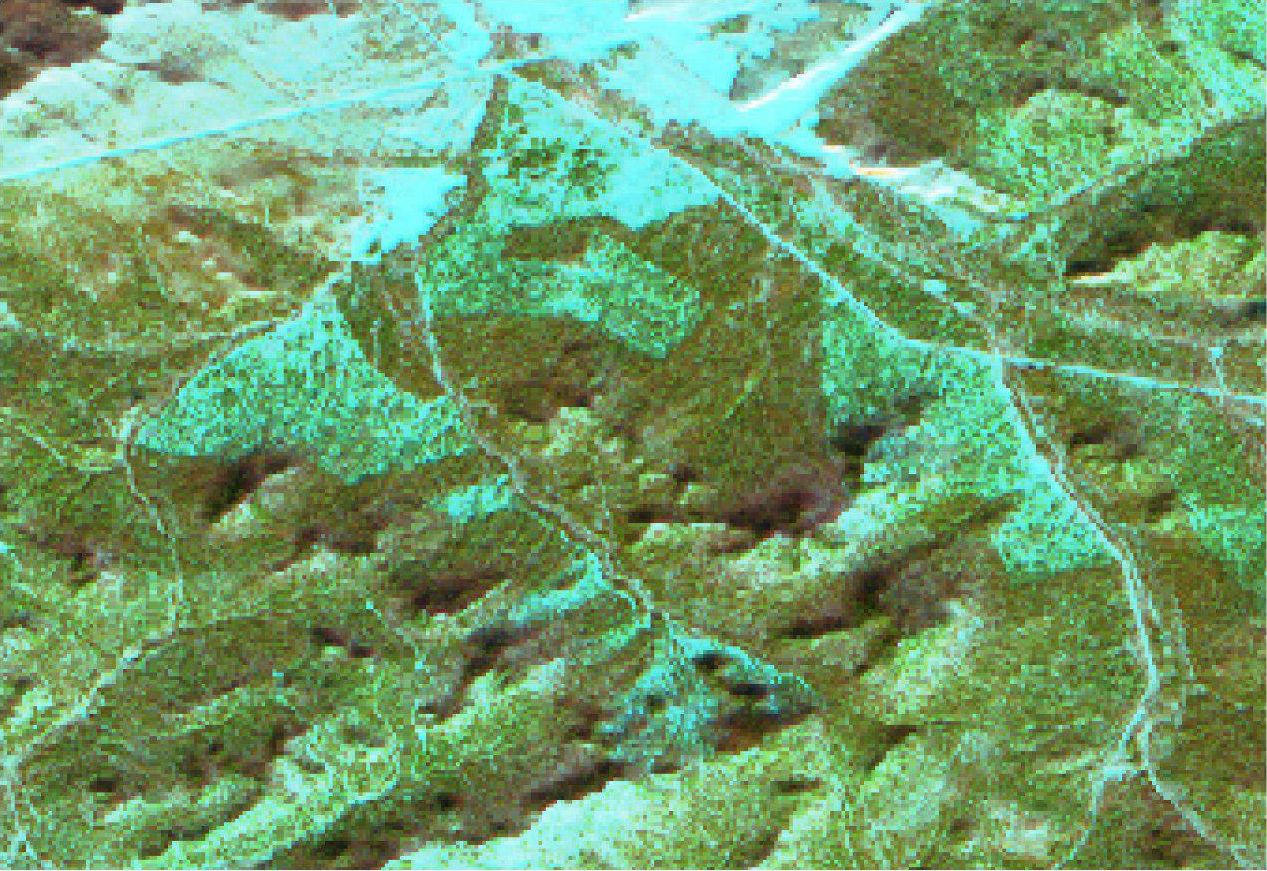
Example of targets: winter logging on a Landsat-8 image
During the project we created a monitoring system that periodically acquires satellite imagery and carries out detection of forest disturbancies. The system returns masks/dates of logging and provides quality assessment of the result.
The detection procedure is implemented using neural networks and other machine learning methods. The detection system is implemented as a a set of program libraries and services that can be called from external systems, for example CEDAR.
The main goal of the system is detection of new logging, so we can’t simply take a satellite image, analyze it independently of other images and return an answer. Instead we need to constantly compare new images with the previous ones, already processed and stored in our database. In other words, we need to solve a special kind of change detection problem. Additionally, there are more challenges specific for our case: large latitudinal range of the region, mountainous relief and winter season.
The usual difficulty that accompanies the analysis of remote sensing data is atmospheric noise due to clouds or haze that can dramatically change reflectance of the Earth surface. Also we have to use images for different dates, thus we need to process scenes for different Sun elevation angles, azimuths and camera positions. But because we’re in the mountains varying geometry of the “Satellite – Sun – Earth Surface” system generates significant differences in the configuration of shadows and illumination of the Earth’s surface.
Finally we process winter scenes, therefore the contents of the image greatly depend on the changing weather conditions. For example, first versions of our system marked freshly fallen snow as change/logging.
All this required the development of special algorithms within a subsystem designed to normalize the data before further analysis.
The change detection model was trained on examples of logging and other changes. The training and testing sets were created by experts in this field: various changes (logging, clouds, etc.) were collected. We trained the network on the data for several past years and tested it on the data for a few years following the training sample.
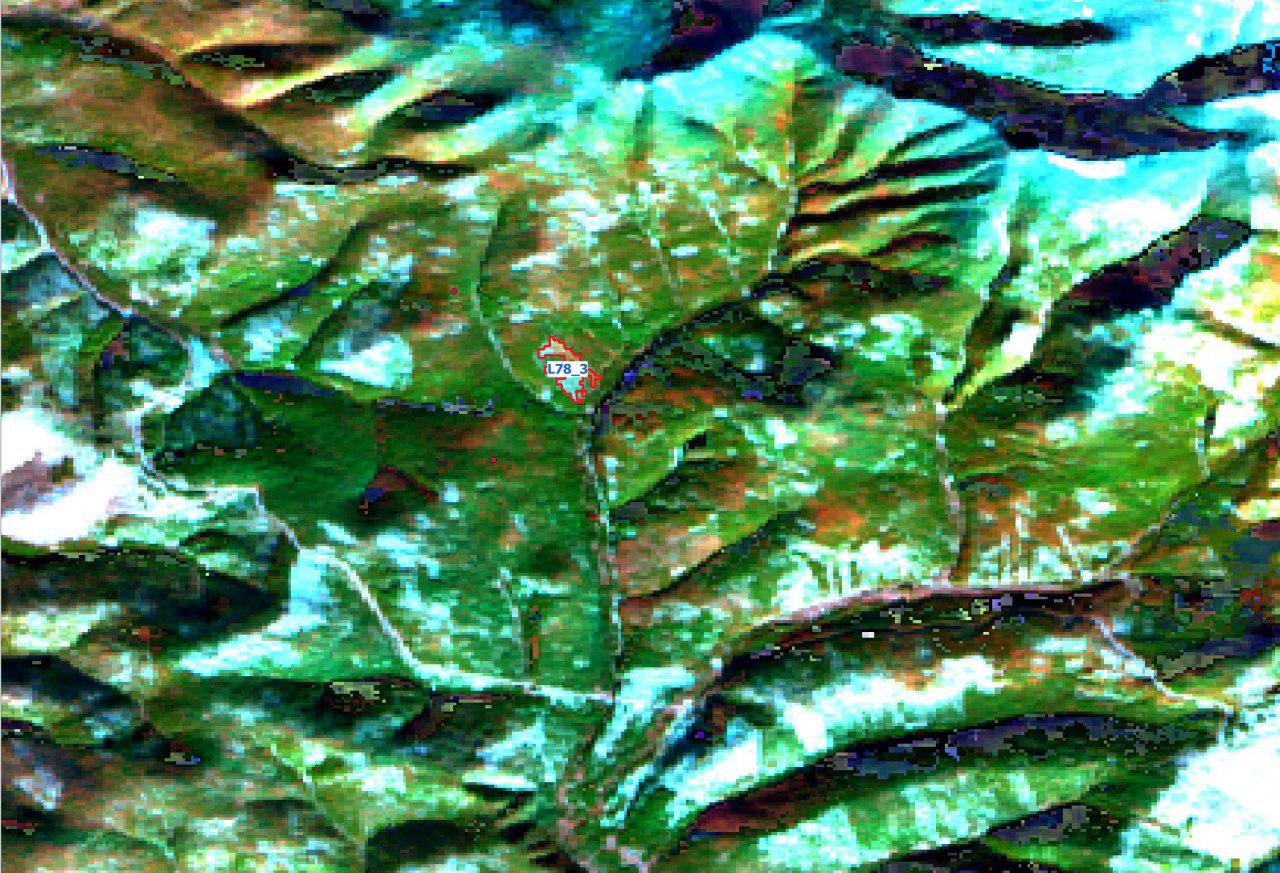
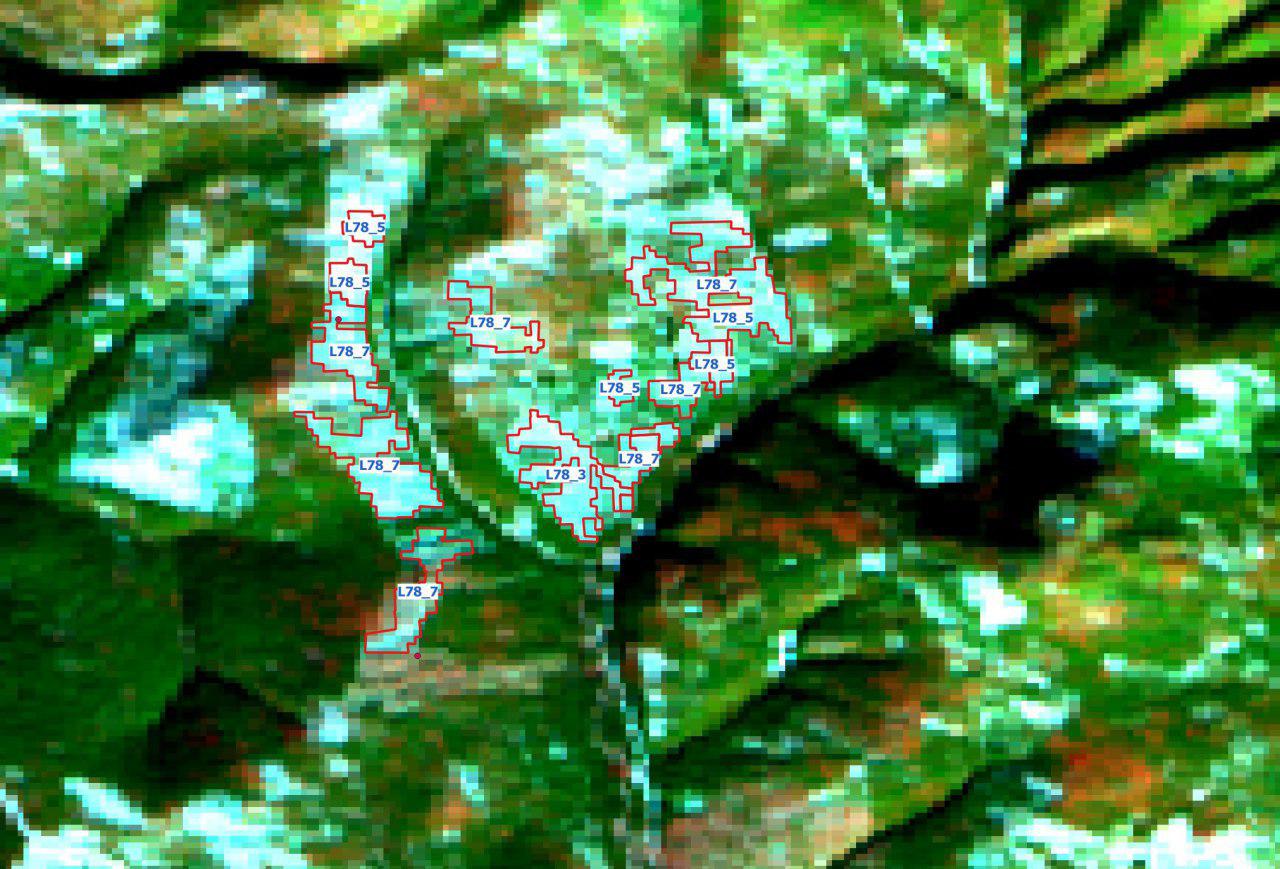
Examples of training data (red polygons)
The system operates in two modes:
1. Training mode. In this mode we parameterize the system. For example, we perform adjustments of the cloud filtering subsystem, data normalization procedures, training of neural network, etc.
2. Logging detection mode. When the training is completed and all the components of the system are initialized, the system begins to work in this mode to analyze newly arrived images and perform automated detection.
The workflow consists of several related components, some are used only at the stage of training and some in both training and detection modes. For example, a general view of the data stream for the search mode is presented below:
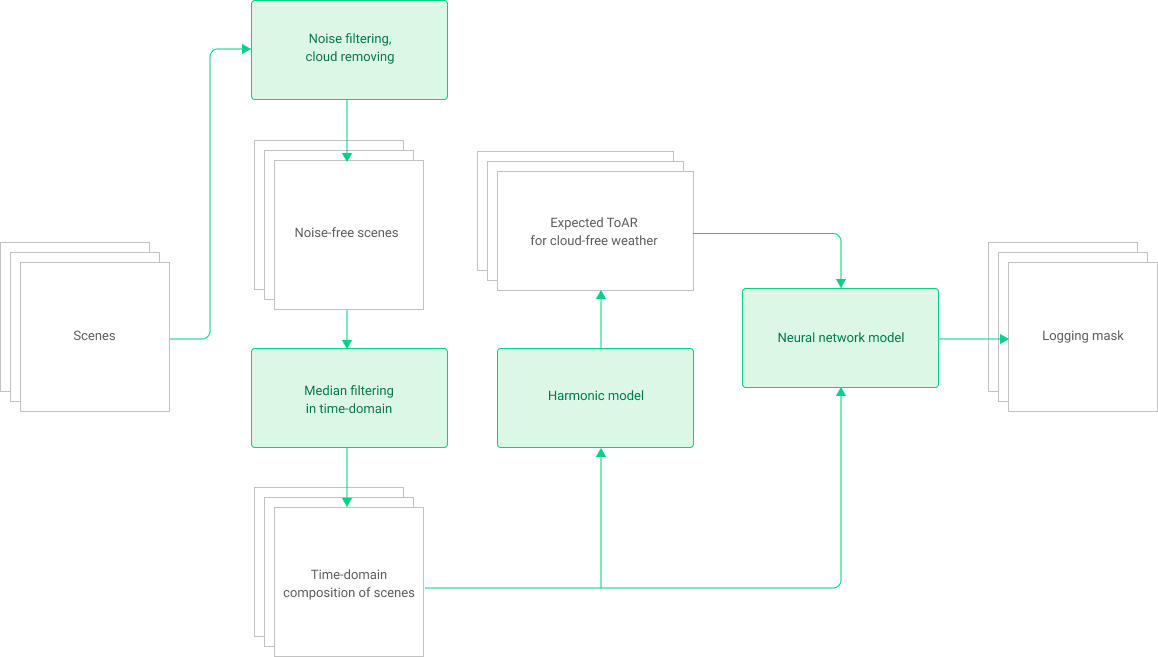
Workflow for detection mode
Clouds are a big problem for the analysis of remote sensing data. Clouds either mask a part of Earth surface or distort its reflectance.
Various algorithms exist for clouds detection, the basis for our model is FMASK. We developed an additional neural network model to complement this algorithm. The quality of the FMASK is quite satisfactory, but the additional model acts as a reserve for the future when other satellite systems not supported by FMASK will be added. For cloud detection we used a neural network model without convolutional layers; the quality of cloud recognition was comparable to FMASK accuracy (which is not surprising, since this algorithm also does not contain a convolution operation).
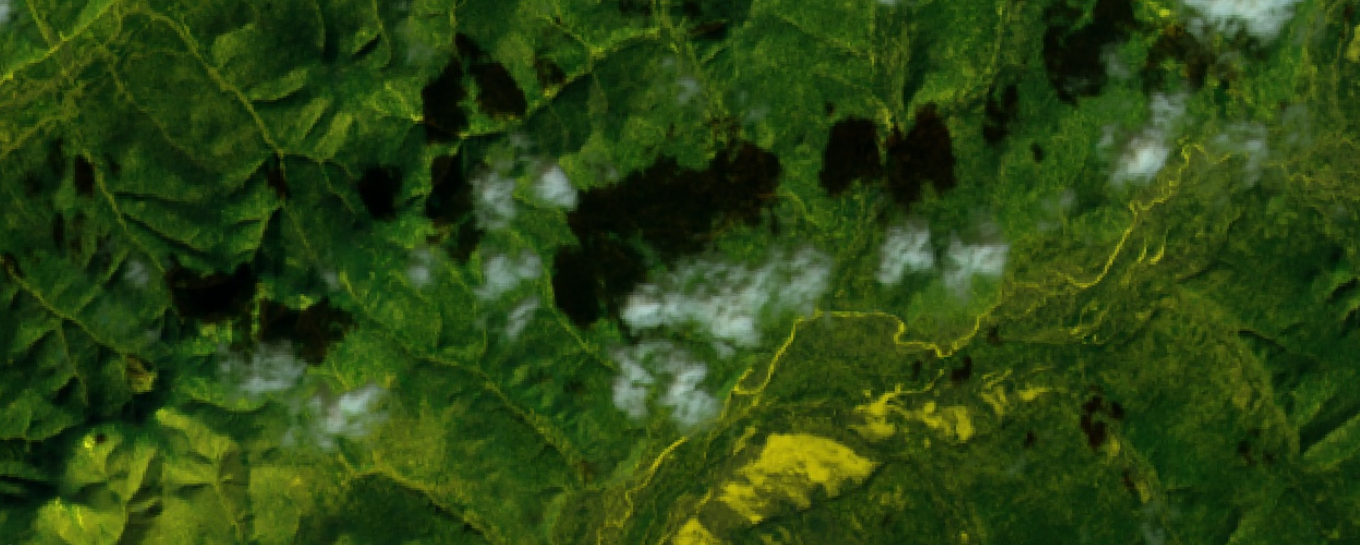
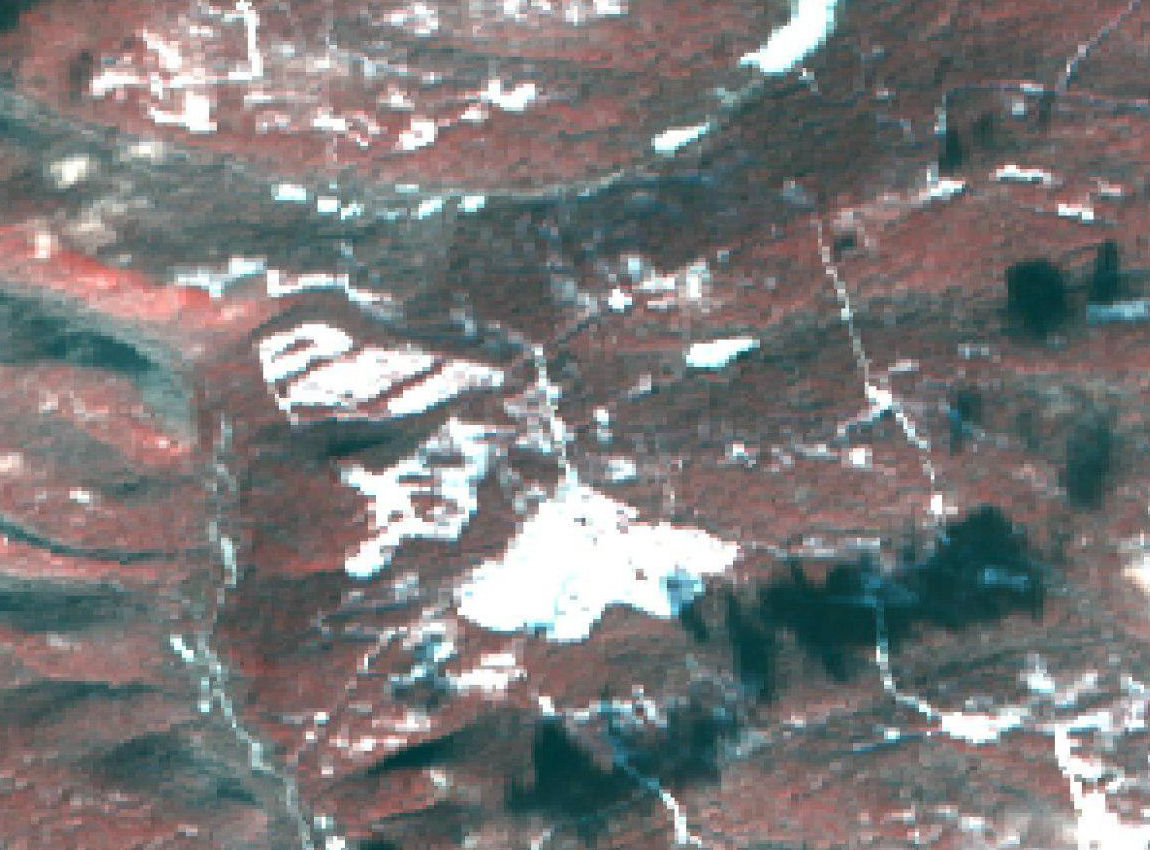
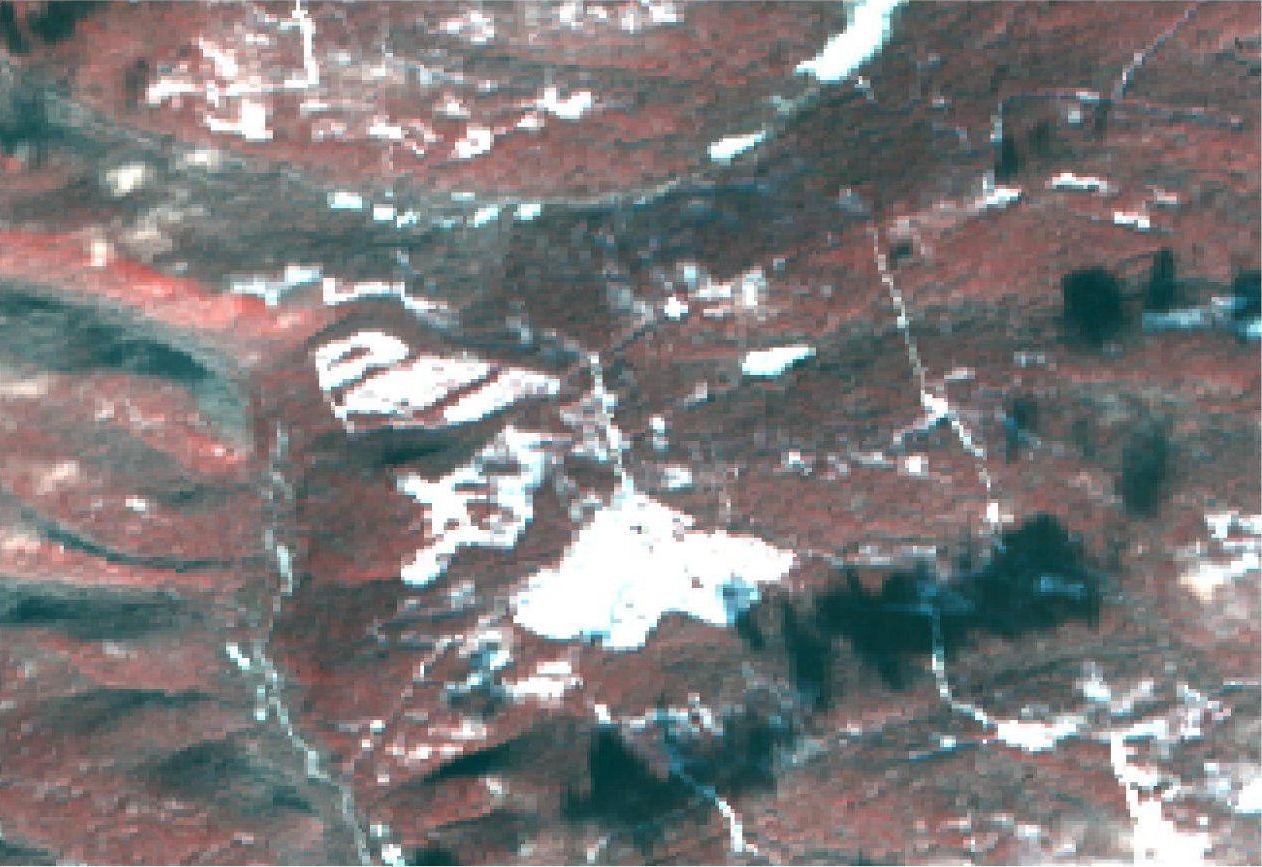
Example of clouds and shadows on Landsat-8 image in synthesized colors (7-5-3)
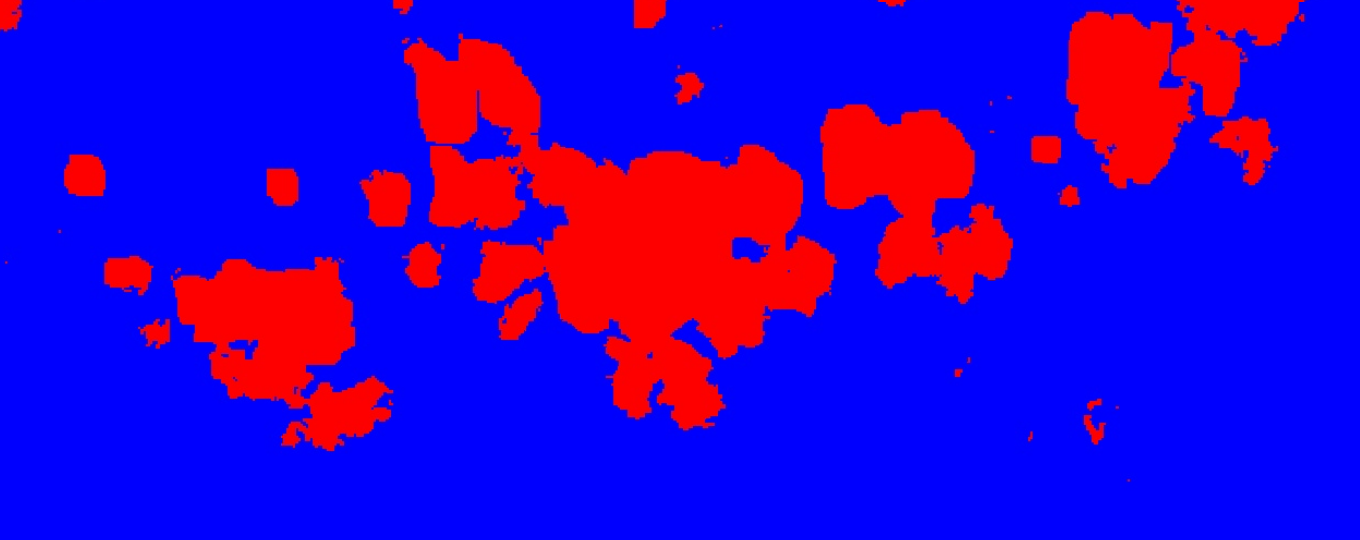
Mask of shadows and clouds for the image above
To simplify the model of change detection, an auxiliary harmonic model was created. The model calculates the expected value of the reflectance of a given point on the Earth’s surface for an arbitrary date, as well as the expected values of some vegetation indices (in particular, NDVI). These expected values can be interpreted as an answer to the question of “what would the satellite camera receive if it captures the Earth’s surface on a given day and time in cloudless conditions?“.
These predicted values of top of atmosphere reflectance (ToAR) and vegetation indices are constructed using a harmonic model and the historical data for previous years. The model takes as inputs:
The model returns a set of coefficients (for linear trend and Fourier sequence). These coefficients determine forms of the curves and predict values of ToAR/vegetation indices for a given date.
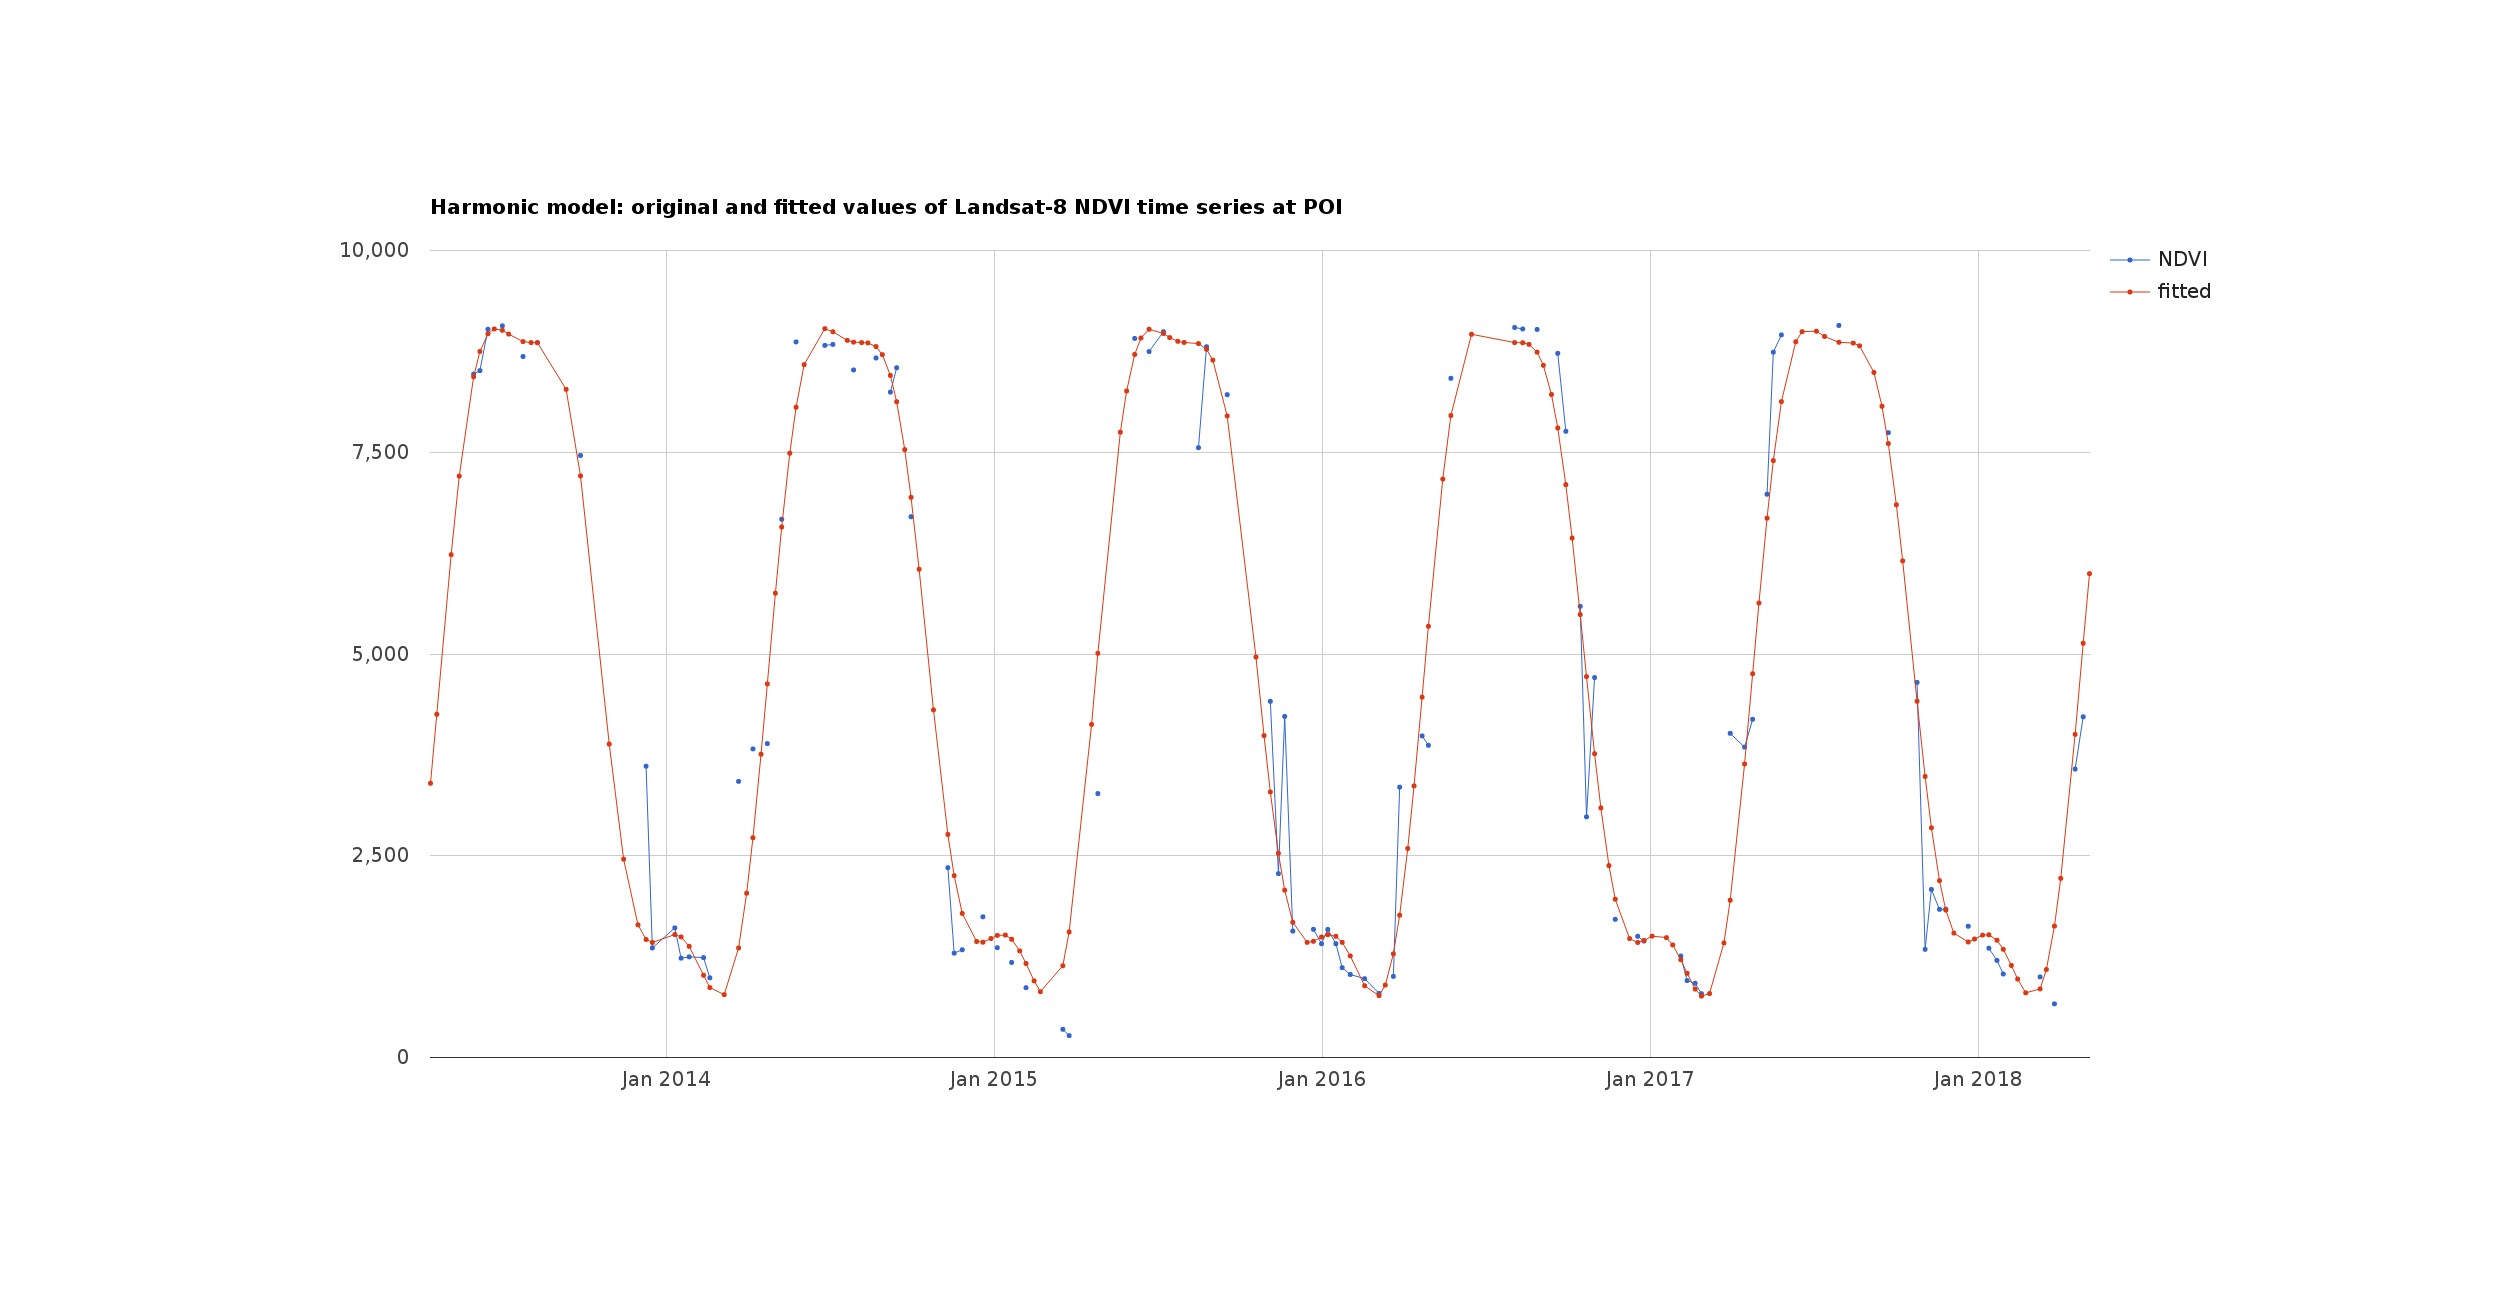
Example of NDVI curve for a point of interest (POI). The time is plotted along the X, the values of scaled NDVI are on the Y.
The figure shows the values of the NDVI (with a modified scale), measured at one of the pixels, similar reconstructions are performed for all pixels of the analyzed territory. The blue dots denote the actual values of the index at the given times, the solid red line indicates the reconstruction of NDVI.
Thus, the harmonic model decreases complexity of the whole system: it filters out noise and emphasizes real changes. As a result, the model for change detection “sees” not only the real data that came from the satellite, but also the expected data (data expected to be seen if no changes had occurred). So we are able to find places with unexpected changes if we compare the expected values returned by the harmonic model with the actually received by the satellite.
The most important component that actually detects changes. The model of change detection is a neural network model that accepts the appropriately prepared data (the outputs from the auxiliary components described above):
The change detection model returns a set of resulting rasters containing codes for the changes (if any) and dates of the changes. Convolutional networks have been used successfully for image analysis in recent years, however we constructed a multi-layer perceptron without convolutional layers: multi-layer perceptron does not require significant resources for training and functioning, but provides acceptable accuracy.
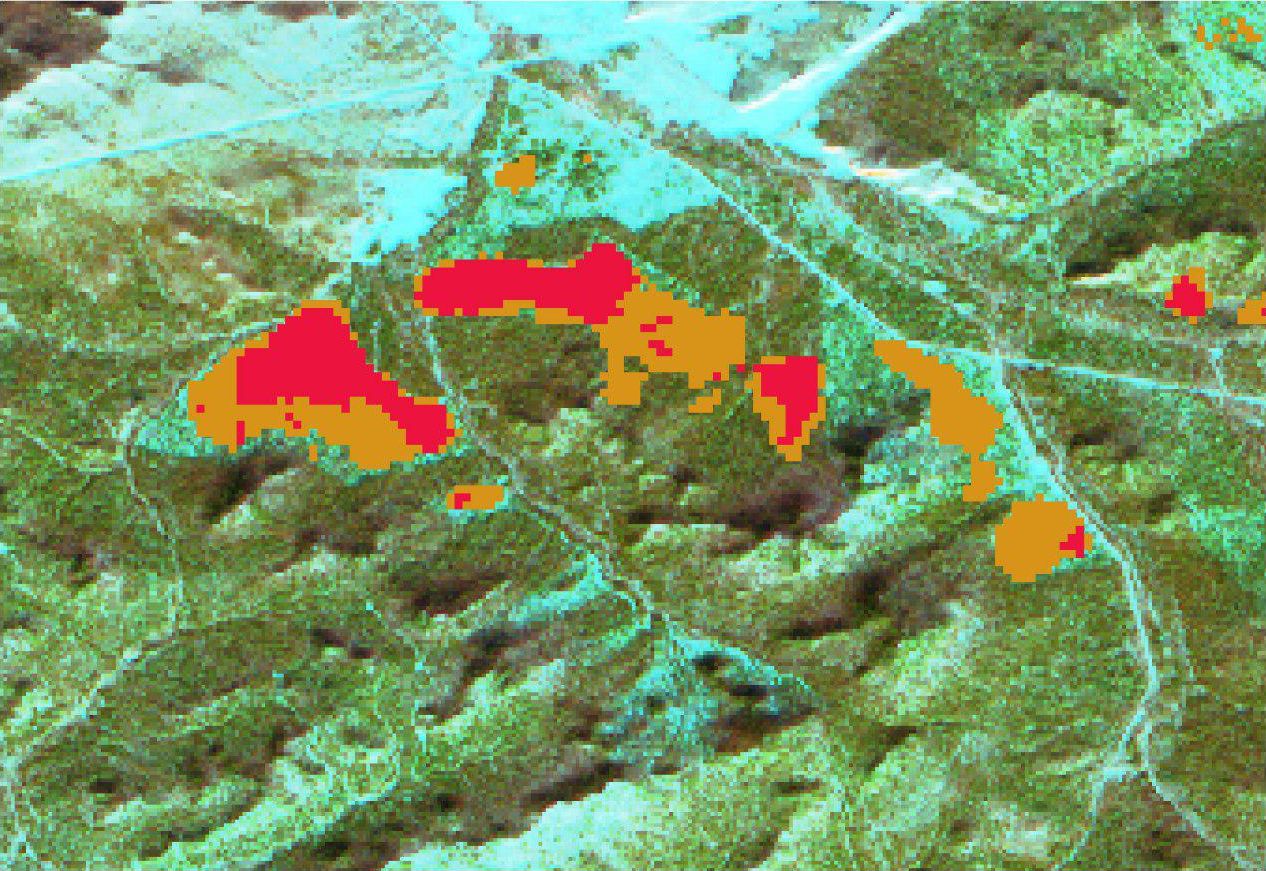
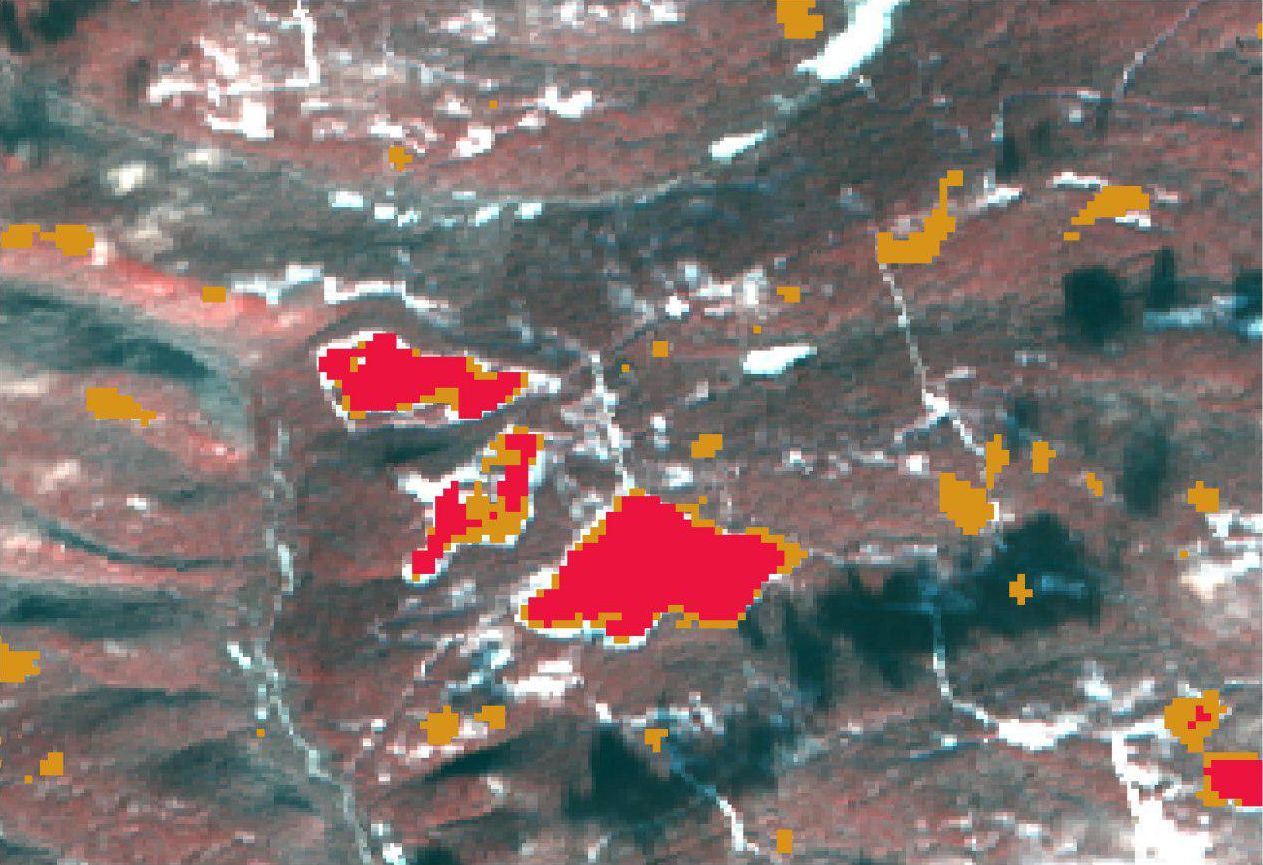
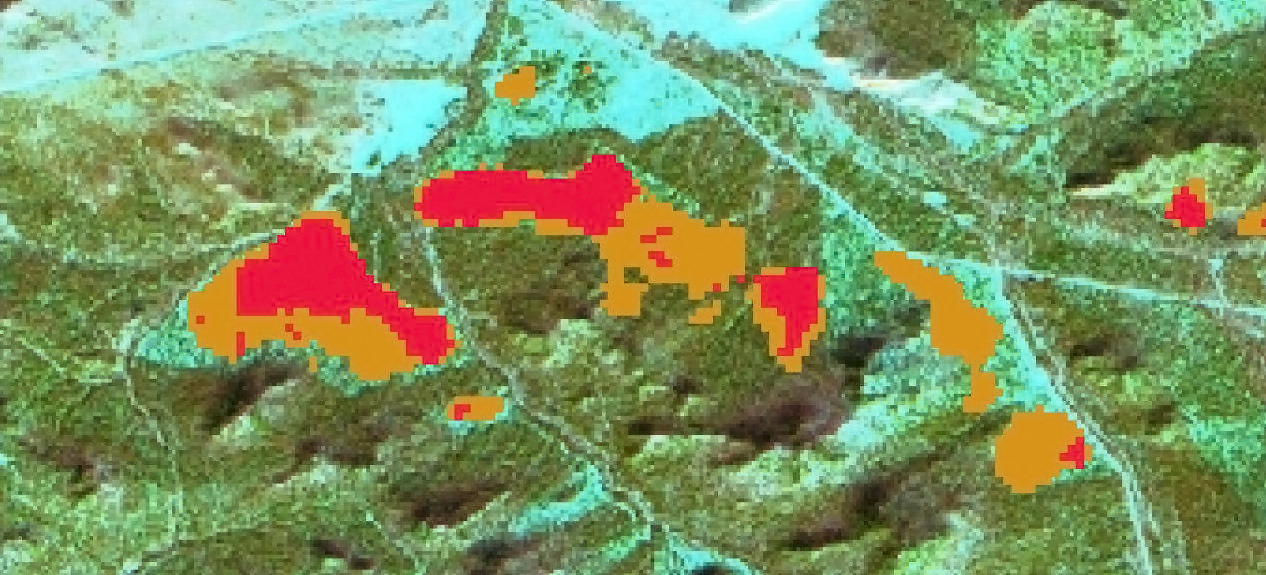
Example of the results. Red marks are confirmed logging (pixels were marked as logging on several images), yellow marks are unconfirmed logging (pixels were marked on one image only, for example they may be recent loggings).
If you have any questions – let us know, we’ll be happy to answer!


