


Creation and processing of spatial data
Ready-made datasets from NextGIS Data and standard GIS software cover basic geospatial needs of the majority of our customers, but sometimes they are not enough. In these cases we offer our geodata processing services, allowing our clients to save their time and money.
The tasks we help to solve can be relatively simple, for example:
- select boundaries of all allotment gardens in Moscow region,
- extract data on all intersections in the road network,
- merge artificially separated sections of road and water infrastructure,
- calculate environment quality indices based on satellite data,
or more complicated. Here are a few examples.
Transport and Pedestrian Reachability Analyses
Our team can swiftly perform reachability analyses of various kinds. You may need this information to calculate areas of delivery from different outlets, or to select an optimal location for your new office/store.
For instance, we have calculated areas of delivery for Instamart chain of stores. In order to do that we have analysed data on all housing and commercial estates located within a set distance from each store (2 to 6 kilometers, with 0.5 km step). Distances were calculated using road network data from OpenStreetMap. As a result the customer has received vector datasets with delivery areas (9 half-kilometer areas for 30 outlets) shown on a city map.
This reachability analysis allowed Instamart to set up optimal delivery areas for each of their stores (based on the shortest car route) and exclude possible overlays between delivery zones of neighboring stores.
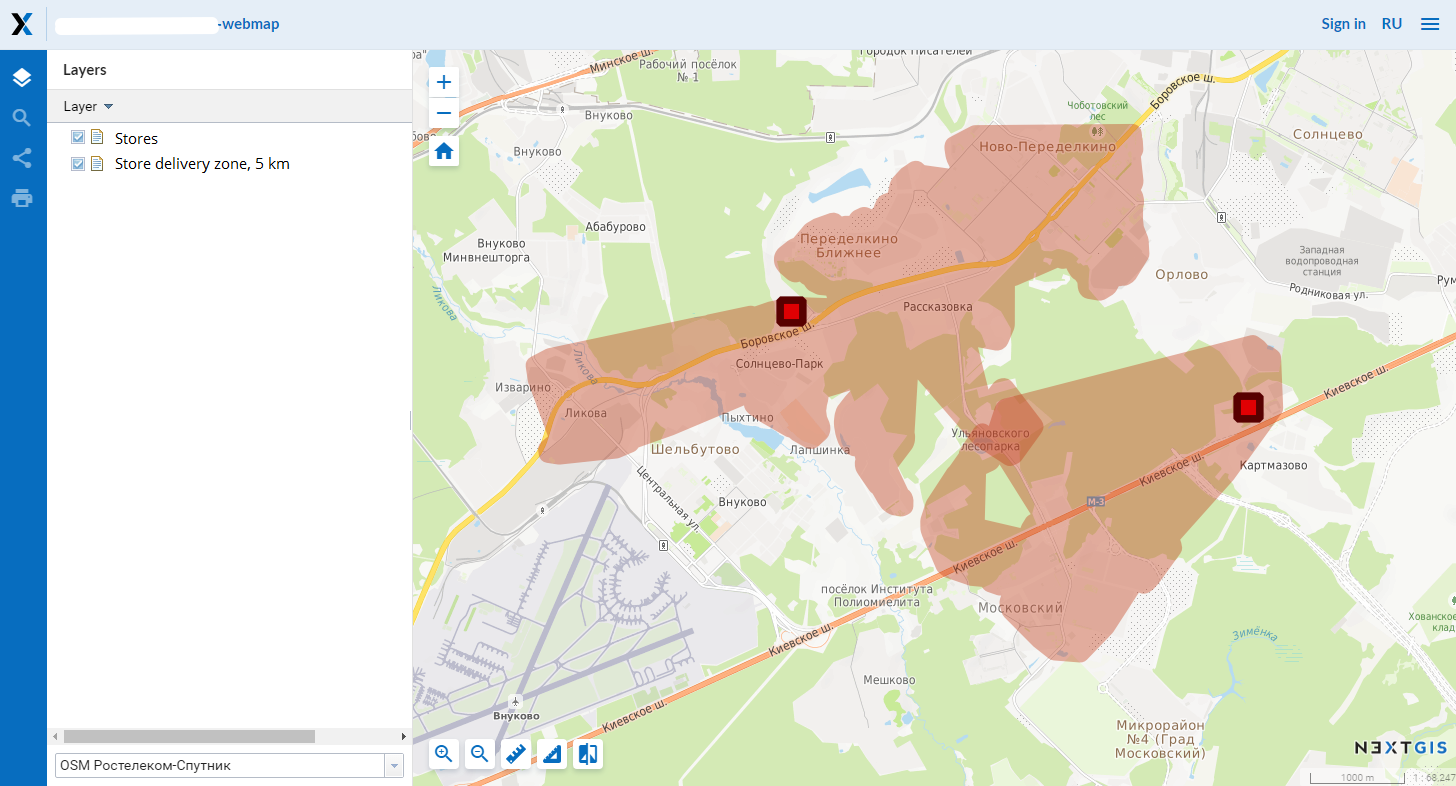
Calculation of delivery zones for Instamart stores (an interim result).
Creation of elevation data for custom areas
We can generate elevation datasets in any of the popular GIS formats, using open data sources.
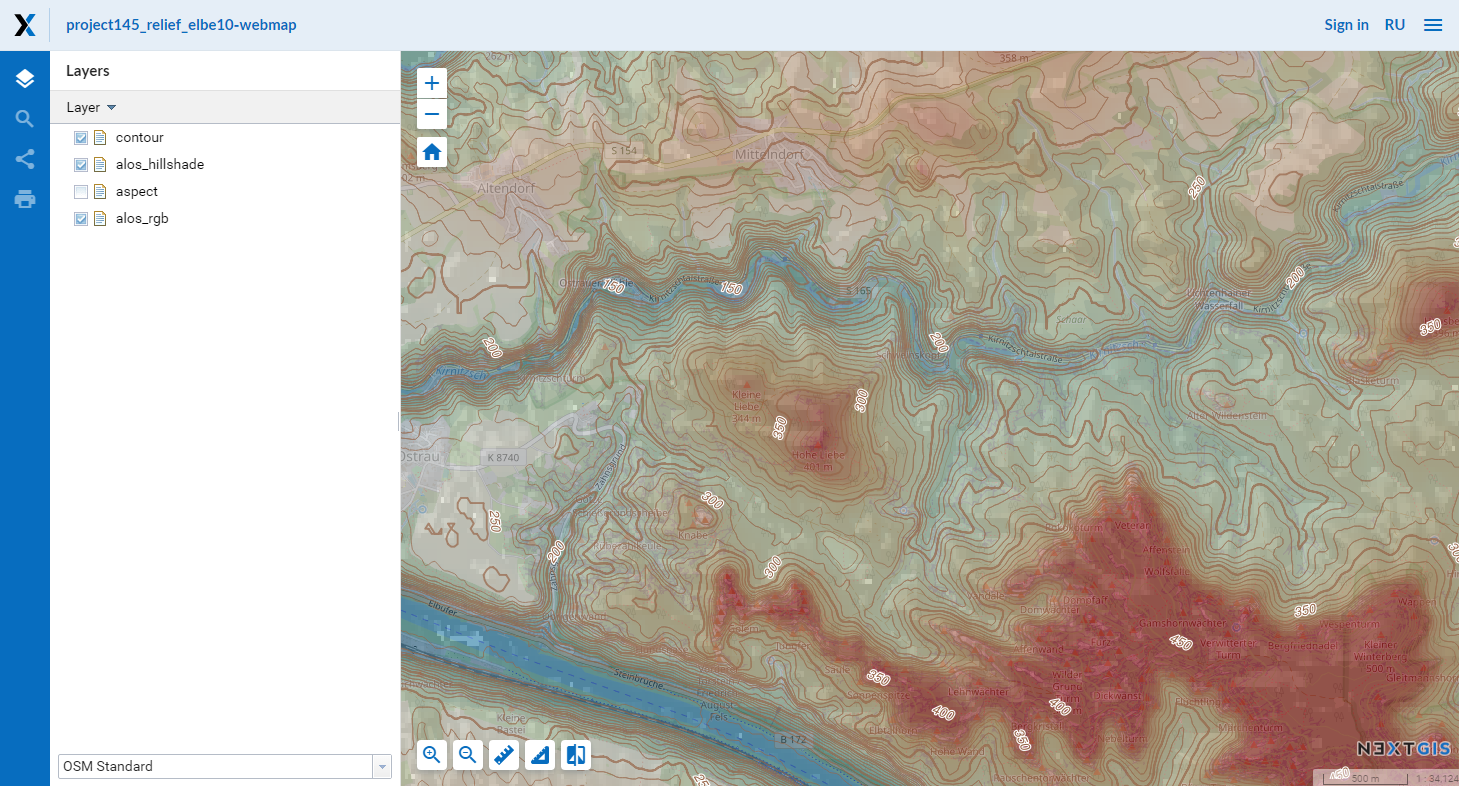
Contour lines, Digital Elevation Model (DEM) and Hillshade for a custom area set by a client.
For example, Fairwaves uses our service to make a primary assessment of built sites for their mobile network base stations. Base station coverage is critically dependant on area relief, and elevation analysis is paramount when assessing possible locations for new base stations. One of the ways to achieve this is to visualize elevation contour lines and viewsheds for a selected point on a map.
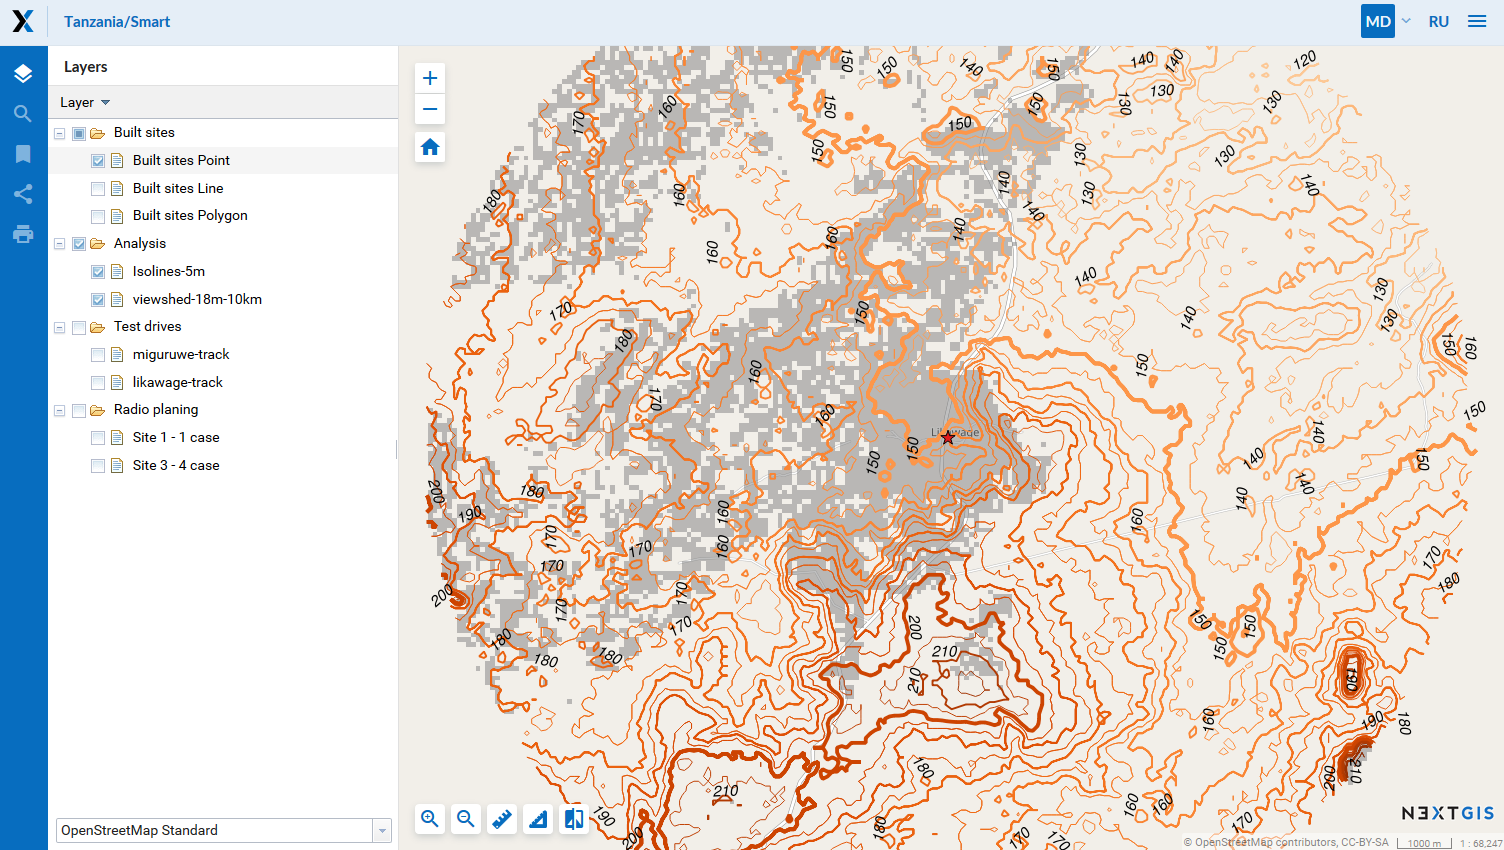
Base stations viewshed analysis for Fairwaves.
Preparation of geodata for BI tools
We prepare and provide regular updates for spatial datasets required by Business Intelligence (BI) systems for data visualization on a national/world map.
Russian brunch of Servier (an international pharmaceutical company) uses datasets on Russia subdivision and administrative boundaries prepared by NextGIS. These datasets contain not only all administrative boundaries features and their IDs, but also the hierarchy of all administrative levels. It allows Servier to use the data in their BI platform and enhance quality of their corporate decision-making.
We can also prepare spatial datasets that will take into account the specifics of your business and BI tools used in your company.
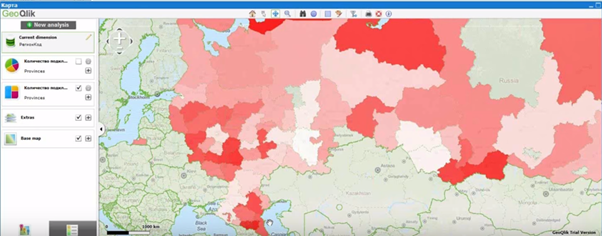
Use of administrative boundaries data in QlikView
Preparation of geodata for third-party libraries and frameworks
In NextGIS we prepares spatial datasets required for data visualization on websites and in various information systems which use third-party libraries and web frameworks.
For example, Russian Ministry of Culture feeds our datasets to their new analytical system developed for better and faster decision-making. This system uses Highcharts.js library for map visualization, which in turn requires specially prepared (custom-formed and generalized) data on subdivision of Russian Federation.
We will be happy to help you adapt or create new spatial datasets specifically for your software development or data visualization tools.
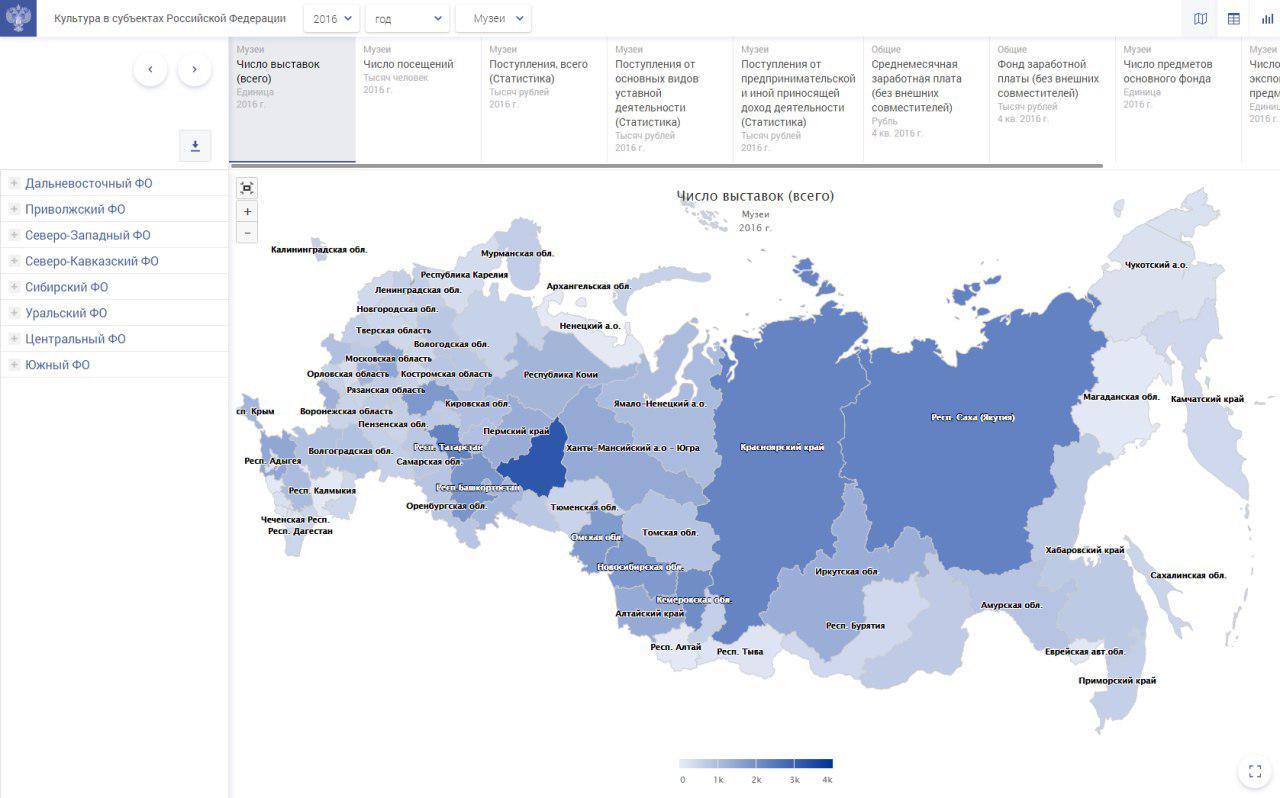
Use of Russian subdivision data by Highcharts.js.