We are pleased to present you with a list of updates in NextGIS Web. In this material, you will find information about all the changes since the beginning of this year. The most significant improvements are visually demonstrated.
Symbols used on a map may require additional clarification. Therefore, web maps now support the display of a legend in the layers panel.
The legend operates in two modes – collapsed and expanded. In the collapsed mode, the legend for a specific layer is revealed when clicked on in the layers panel. In the expanded mode, the legend is always visible. When the legend is turned off, you will only see the list of layers and their structure.
You can configure the legend display mode for all web maps in your Web GIS from the control panel. Customization of the legend is also possible for individual web maps and specific layers within a web map.
During the development of the new legend, the layer tree itself has been improved. Additionally, the option to change the order of layers through simple drag and drop has been added.
In the context menu of each layer, the transparency settings for the layer during web map viewing have been introduced.
Zooming to extent is now available not only for a specific layer within a web map but for all layers simultaneously. It is also possible to zoom to a filtered set of objects.
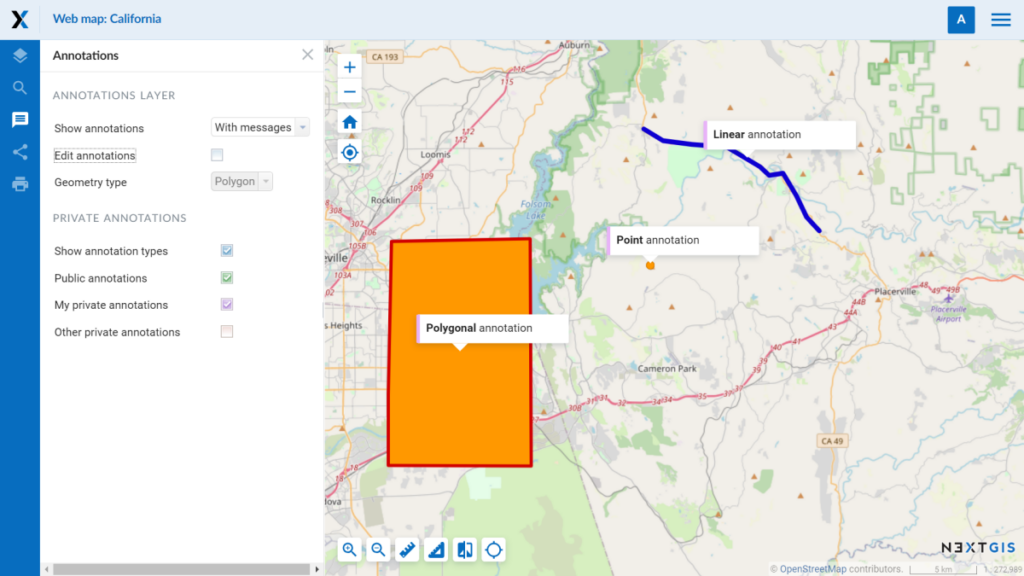
Annotations on web maps serve as a useful tool for comments. You can create point, line, and polygon annotations.
Adjust the size and formatting of text in the versatile editor, and customize the appearance of selected areas.
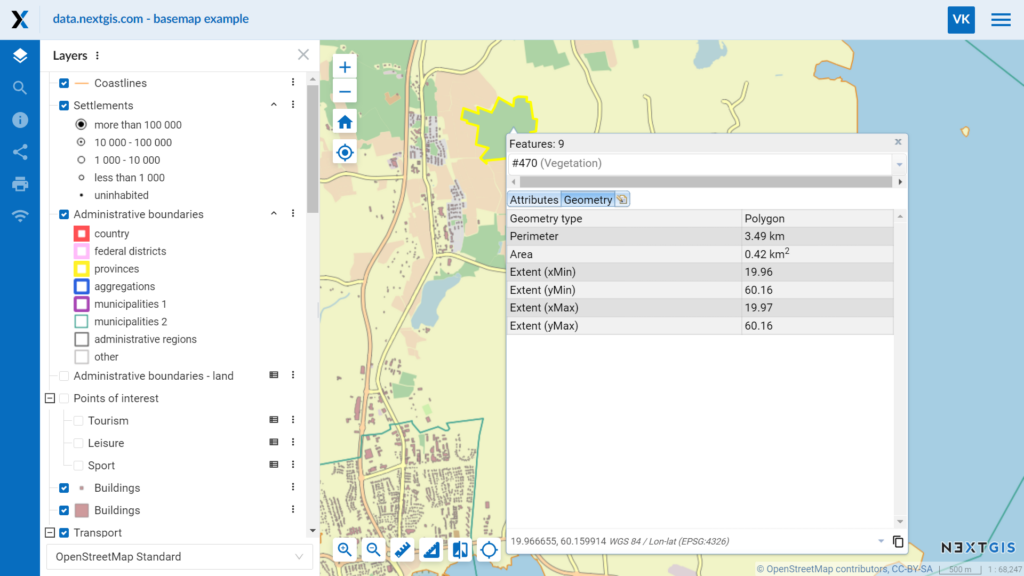
In the feature identification window on web maps, you can view geometry properties, such as the geometry type, area, perimeter, and extent.
At the bottom of web maps, a small window displays the current map extent and the cursor coordinates.
There are three ways to create web maps:
NextGIS Web enables you to create and edit objects on the web map, as well as work with layer attributes. With the capability to create empty layers, NextGIS Web has become a standalone web map builder!
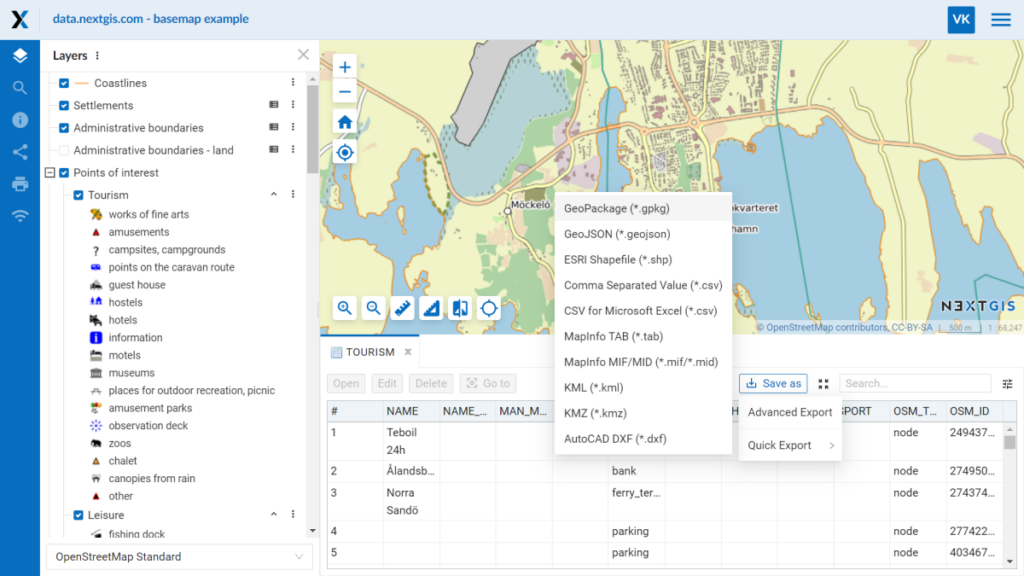
You can download geodata from your Web GIS. For vector layers, you can selectively export data by limiting the extent or exporting only filtered objects.
In the first case, you manually input the coordinate extent (which can be copied from the window at the bottom of the web map). In the second case, you utilize the new quick export function of the attribute table, which is accessible in the web map interface or separately.
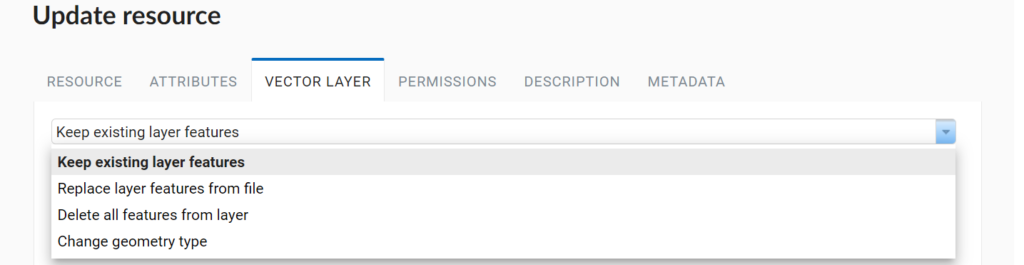
You can update and modify existing vector layers using the following methods:
Default resource names upon creation. If you forget to enter a name when creating a layer, folder, web map, or any other resource, an error message won’t be displayed prompting you to fill in the missing field. Instead, the resource will be assigned a default name, which you can later modify if necessary. Additionally, when creating a new layer, the data upload tab opens automatically as a higher priority.
MapInfo format support when creating a vector layer. You can upload data in MIF/MID and TAB formats by first placing the layer files in a ZIP archive.
TMS client: parallel tile fetching and HTTP/2. These changes enable faster loading and displaying of TMS services on your web maps.
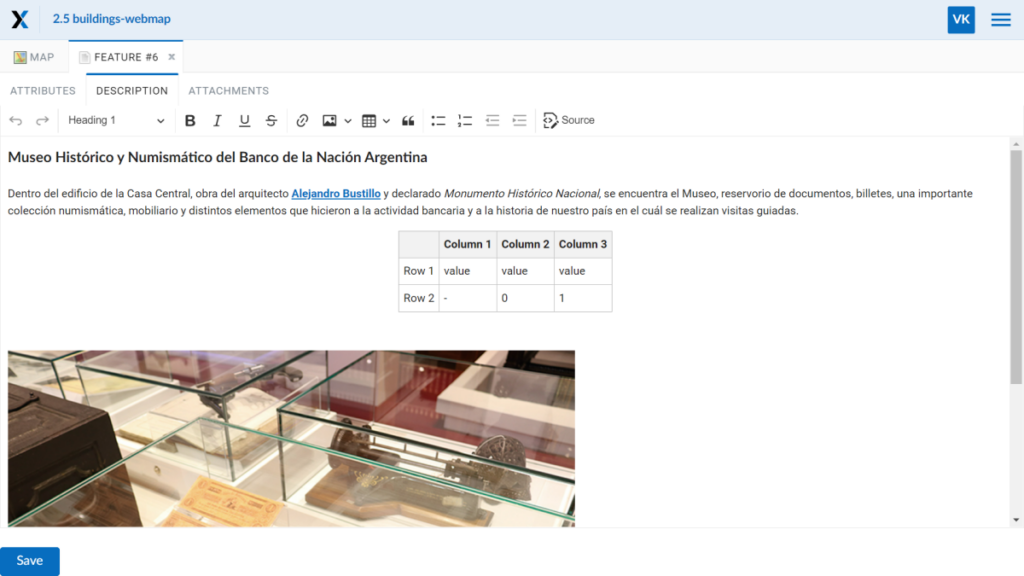
Individual resources and objects in Web GIS can have descriptions. The description editor has been upgraded to CKEditor 5, providing improved performance. It supports:
Newly added features include the ability to insert tables and format headers.
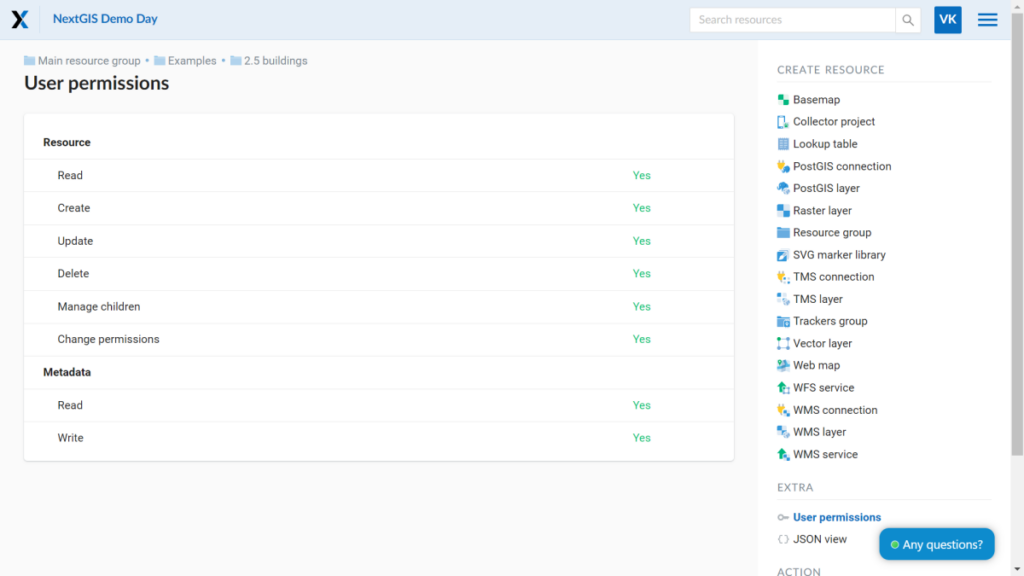
Custom user permissions for resources have been moved to a separate page. Look for the “User Permissions” button in the “Additional” block on the right.