NextGIS has finished developing a spatial Information system on animal and plant species of Khanty–Mansi Autonomous Okrug. This work was conducted within the framework of creation of Redlist of the region. The main goal of the system is to unify and allow preliminary analysis of biodiversity data of the region. The customer is the Department of Ecology of Khanty–Mansi Autonomous Okrug.
Developed system is online at ugrabio.ru
The information system is designed for management tasks such as checking for presence of red-listed species on specific area and to support preliminary scientific inquiries, such as modeling ranges of rare species and help assessment of degree of rarity of a particular species.
Objectives of the information system:
- providing remote access for the database of species distribution, including species red-listed in the region;
- help collect animals and plant species locations within the region by project participants (protected areas stuff, scientists, other specialists) via web;
- allow preliminary visual analysis of the distribution of species using automatically generated maps of distribution;
- facilitate source data use for different kinds of analyses using external software (via export functionality).
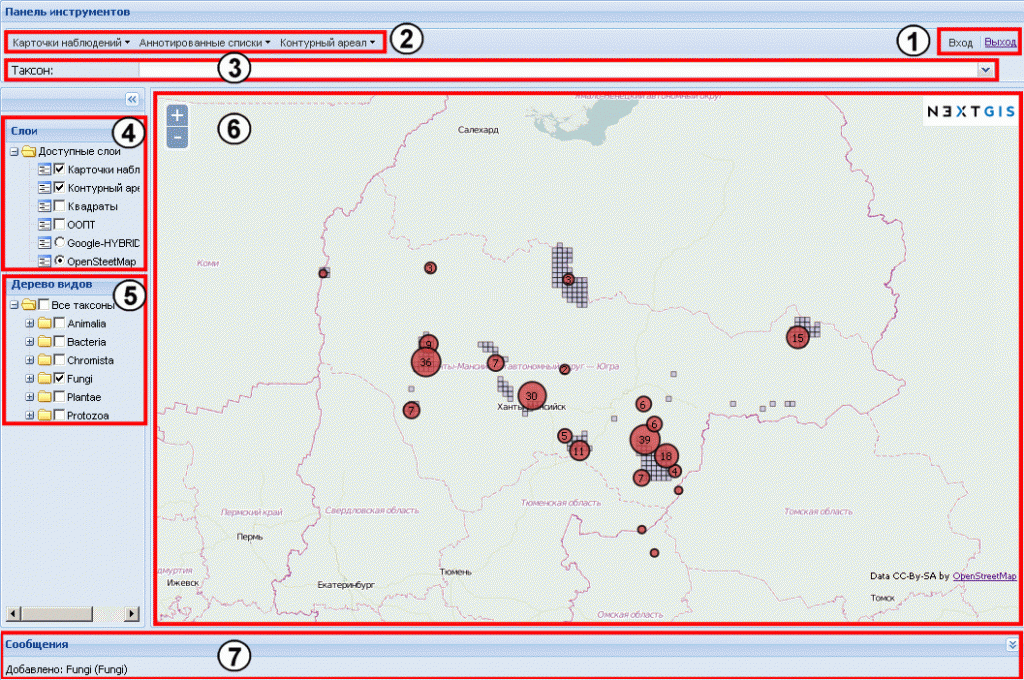
Interface of the information system includes:
- Authorization panel – provides regulation mechanism, users are divided into administators, editors and visitors
- Editor’s panel – tools to create new red-listed species evidence cards and annotated lists
- Search panel – text search box that allows finding any taxonomic group (from kingdom to subspecies) to show on the map.
- Layers panel – area where one can choose layers and basemaps to select of the map.
- Taxonomic tree panel – provides convenient navigation on taxonomic tree.
- Map – visualizes selected layers and species.
- Messages panel – shows user actions in a text form.

General overview
Editor’s toolbox include:
- Tools to edit evidence cards and annotated lists (1,3)
- Export of evidence cards and annotated lists to CSV (2,4)
- Export species ranges polygons to Экспорт контурных ареалов вида в ESRI Shape (5)
- Export all database tables to CSV (6)

Editor’s toolbox view
The main objective of the application is to show species locations and allow to see and edit data quickly.

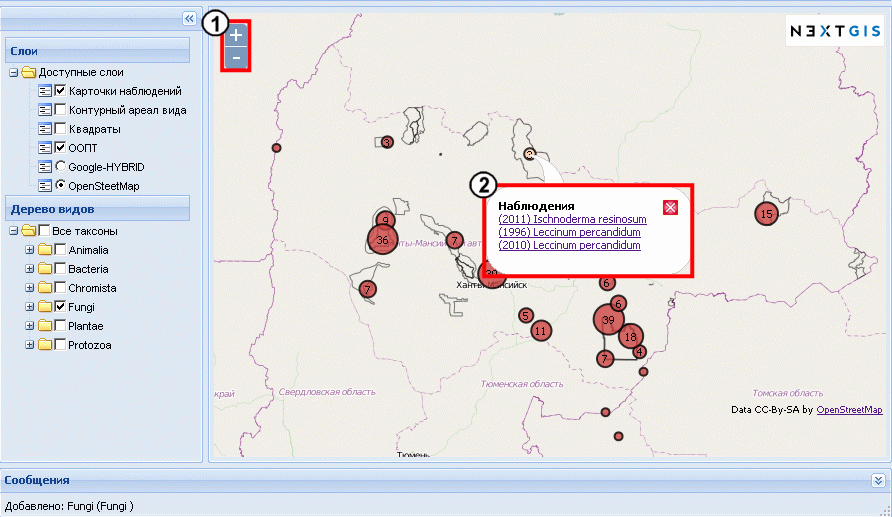
Clustered locations of Fungi on map view, navigation controls (1) and list of species in a specific cluster (2).
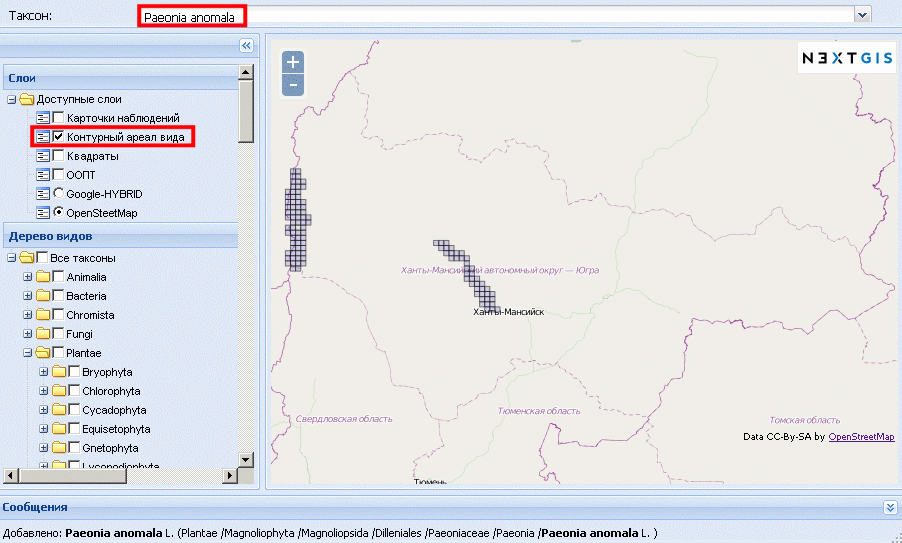
Besides locations, system allows automatic creation of species ranges from annotated lists (list of species for a specific area, not necessarily a point) assigned to grid cells.

Example of generated distribution range of Paeonia anomala
The system is built using exclusively open-source, server side uses Pyramid and PostgreSQL/PostGIS, web-client is built with ExtJS 3.4, OpenLayers и GeoExt.
