This year, we took part in the #30DayMapChallenge for the second time. We got more of our team members involved in creating maps, though it meant pulling them away from their regular tasks 😁
You may have followed our posts on X and Instagram. Now, you can revisit our maps – but this time, enjoy them in higher quality and explore all the details!
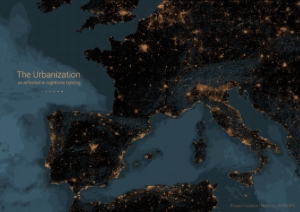
Night lights are an ideal tool for tracking urbanization and its dynamics.
EV chargers are increasingly vital to European transport infrastructure.
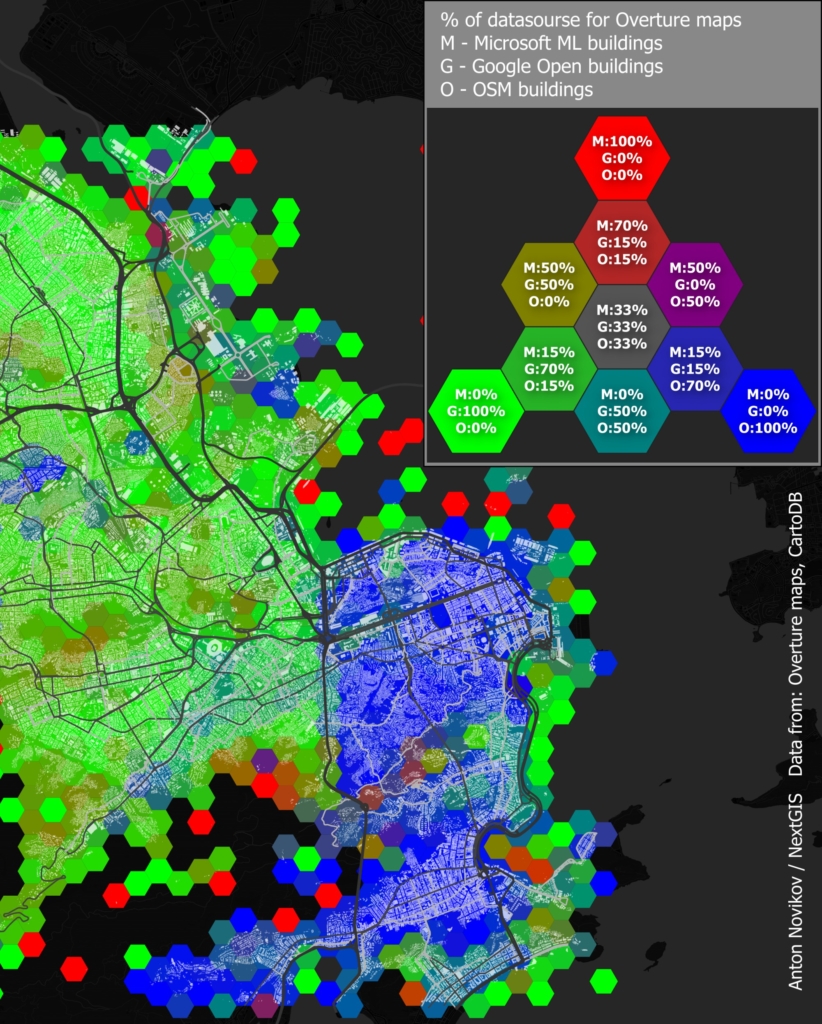
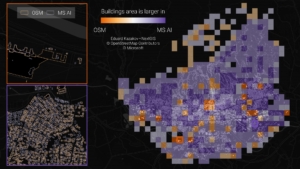
Many open sources offer building data, including OSM and Microsoft AI.
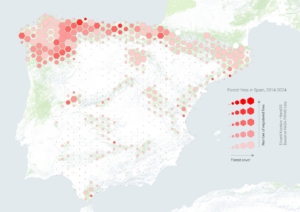
This map visualizes 10 years of forest fires in Spain.
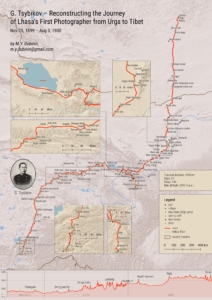
Disguised as a Buddhist pilgrim, G.Tsybikov visited Lhasa in 1900, bringing back its first photos.
These images helped shape National Geographic as we know it today. The reconstruction drew from research into 176 toponyms from his travelogue.
This map shows how Honduras and Nicaragua’s tropical forests have thinned over the past 20 years.
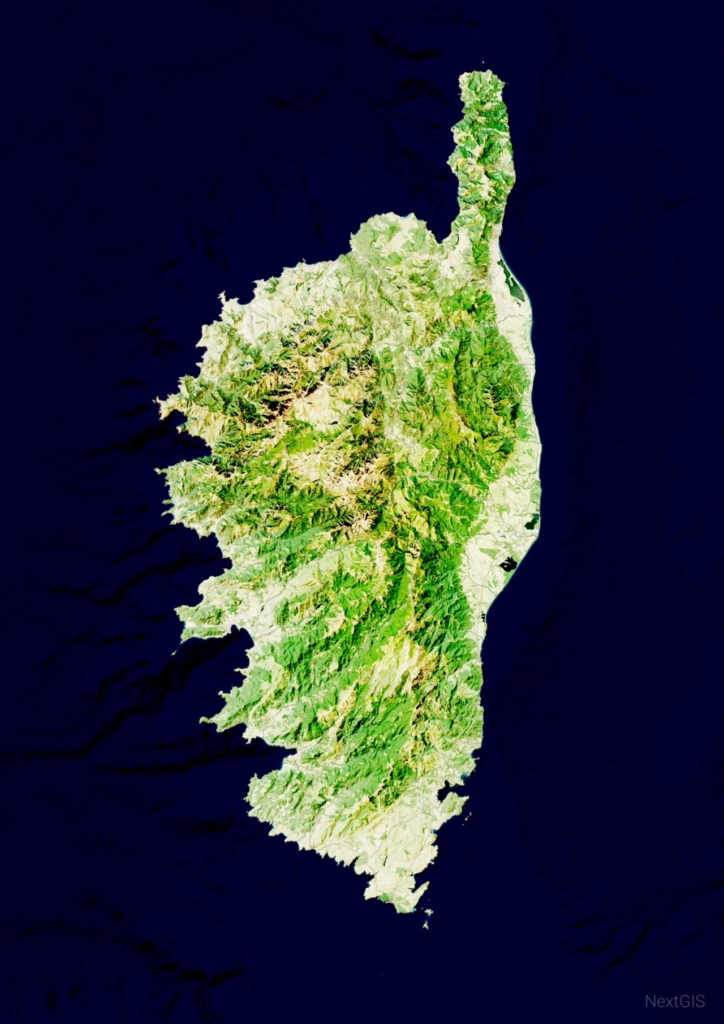
Just classic Corsica.
The 2023 earthquakes in Turkey and Syria shocked the world. This map illustrates the scale of the disaster and the number of people affected.
Go to HDX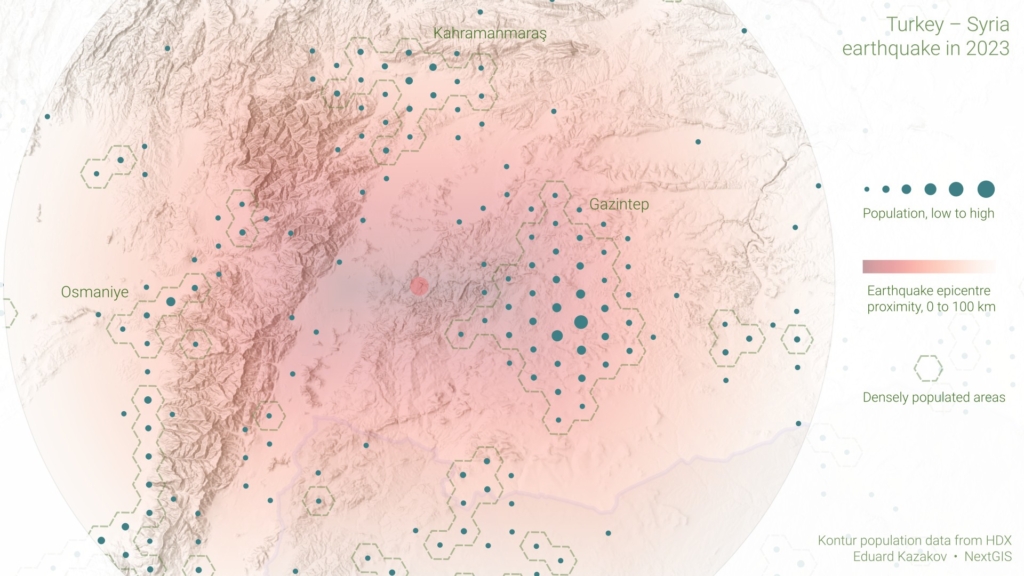
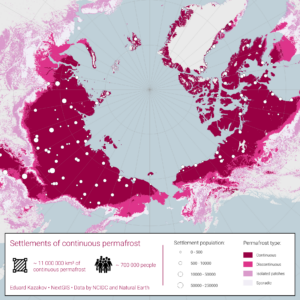
Continuous permafrost covers 11 million km², yet over 700,000 people live there!
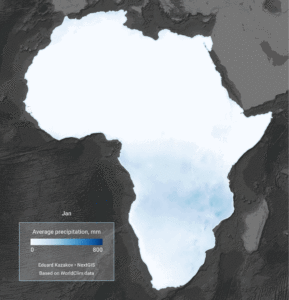
Africa’s precipitation patterns: dynamic pulses across time and space.
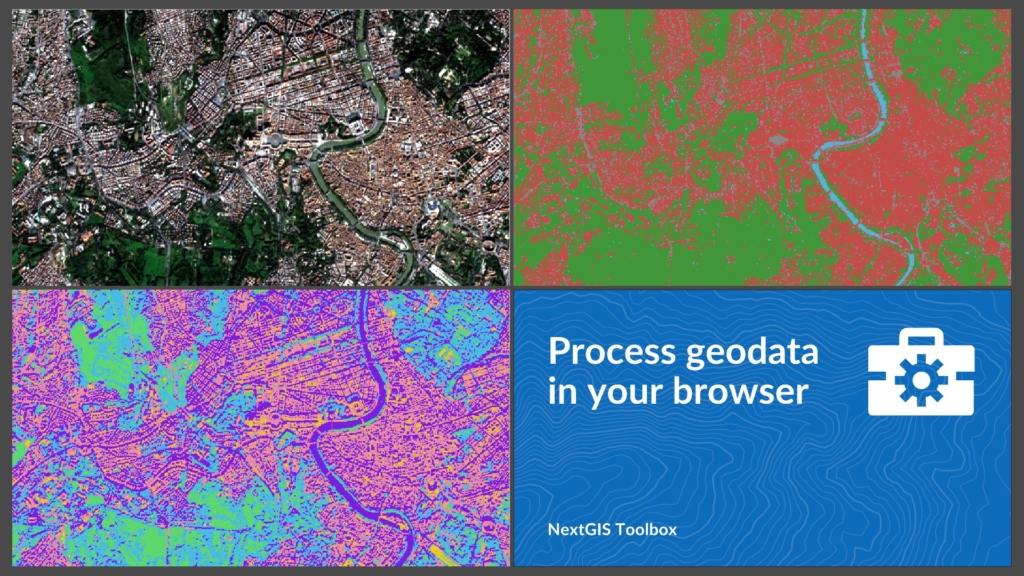
NextGIS Toolbox is a suite of online tools for geospatial data processing. New features now enable fast and easy clustering and classification of geospatial images.
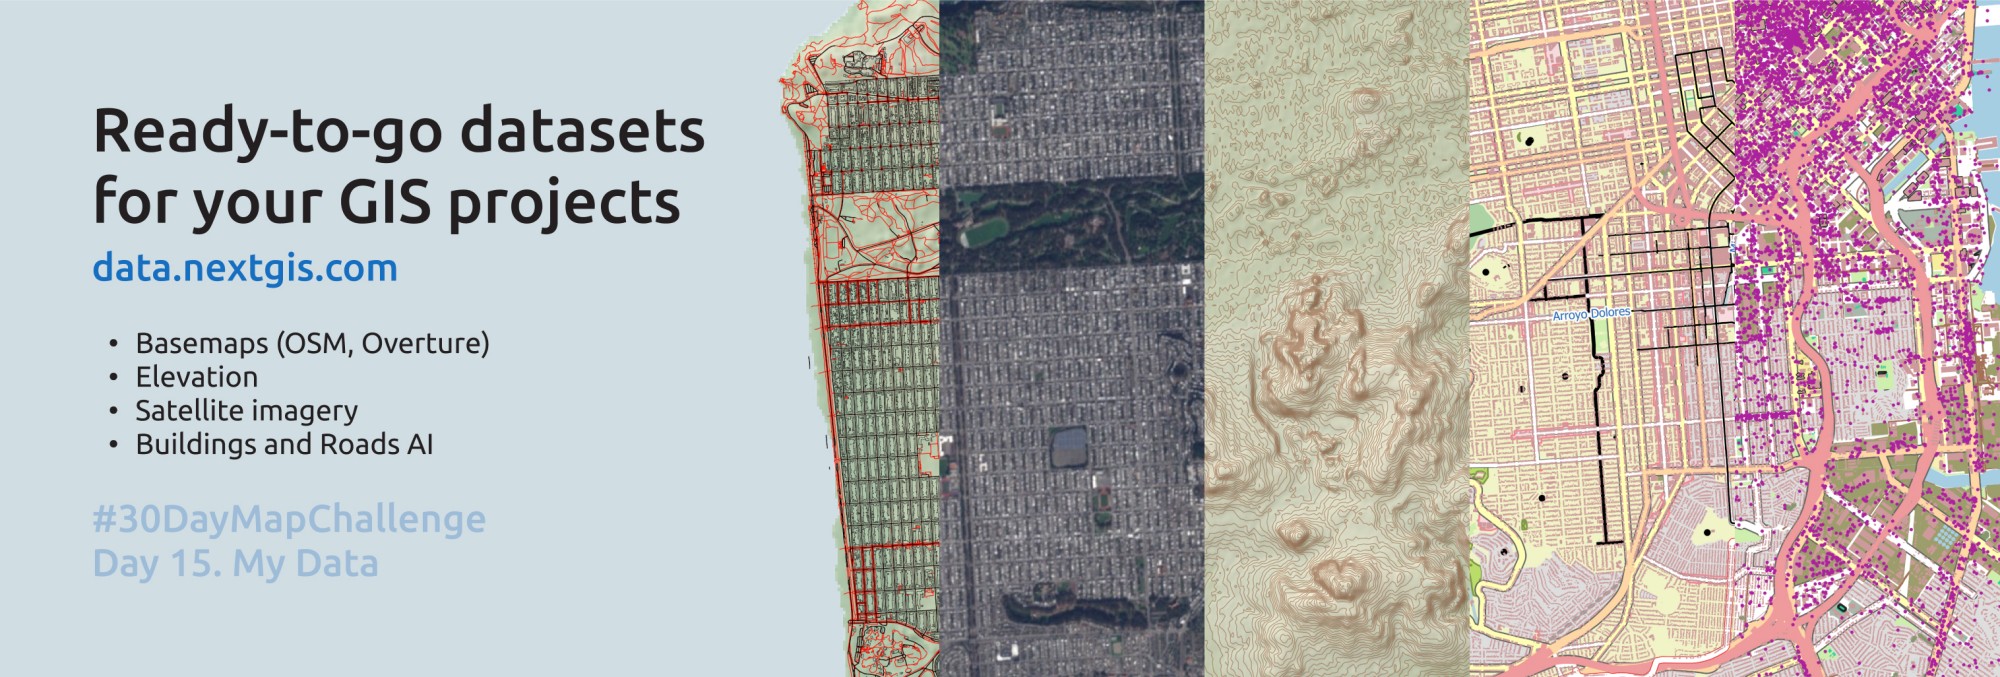
The map showcases several datasets available for order via NextGIS Data:
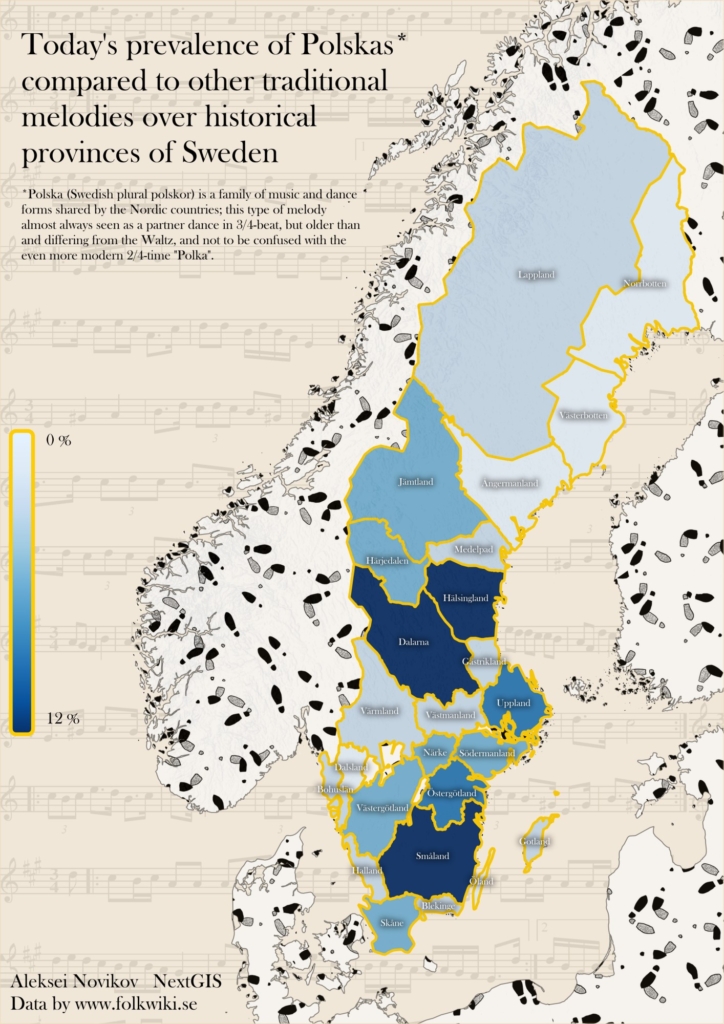
What I think about when I think about Sweden? Polska, of course!
We love playing polska, it’s mesmerizing to see people dancing to its rhythm. But from which part of Sweden do most polskas originate? Let’s find out!
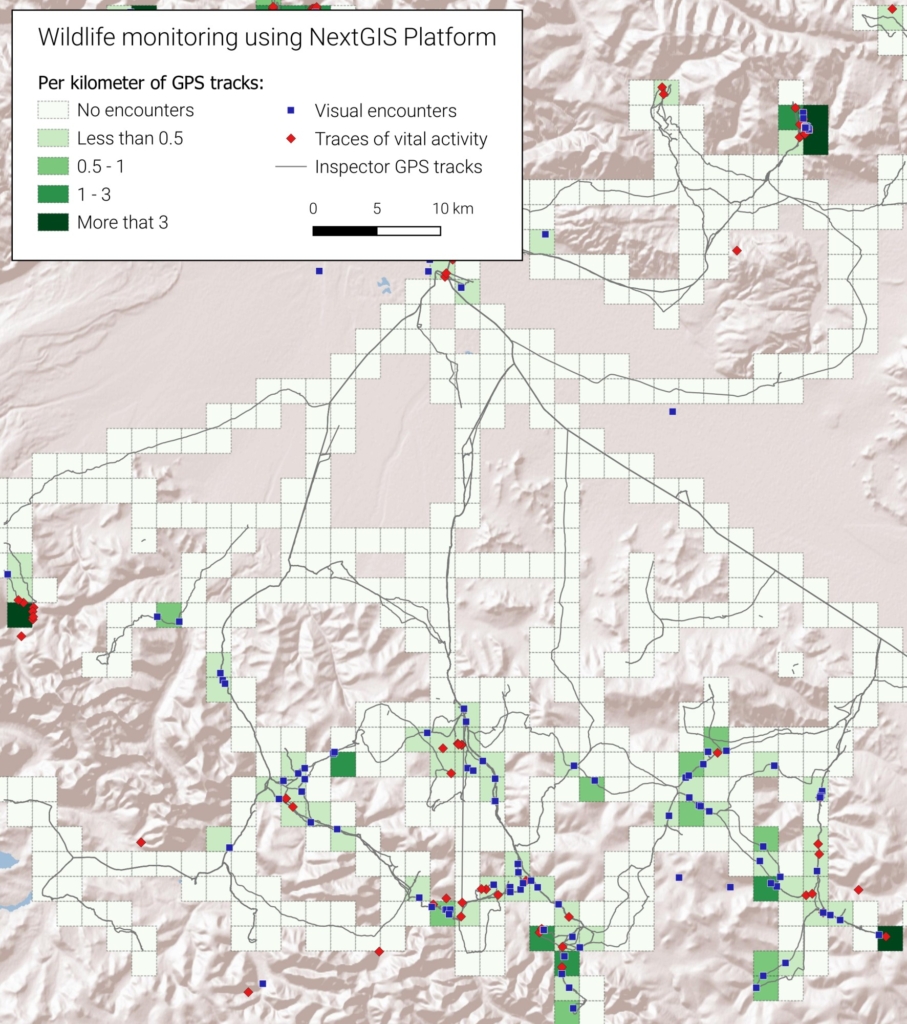
NextGIS Platform is an ideal solution for organizing collaborative work with geospatial data.
Collect data via mobile devices, make simultaneous edits, gather and analyze GPS tracks, and more.
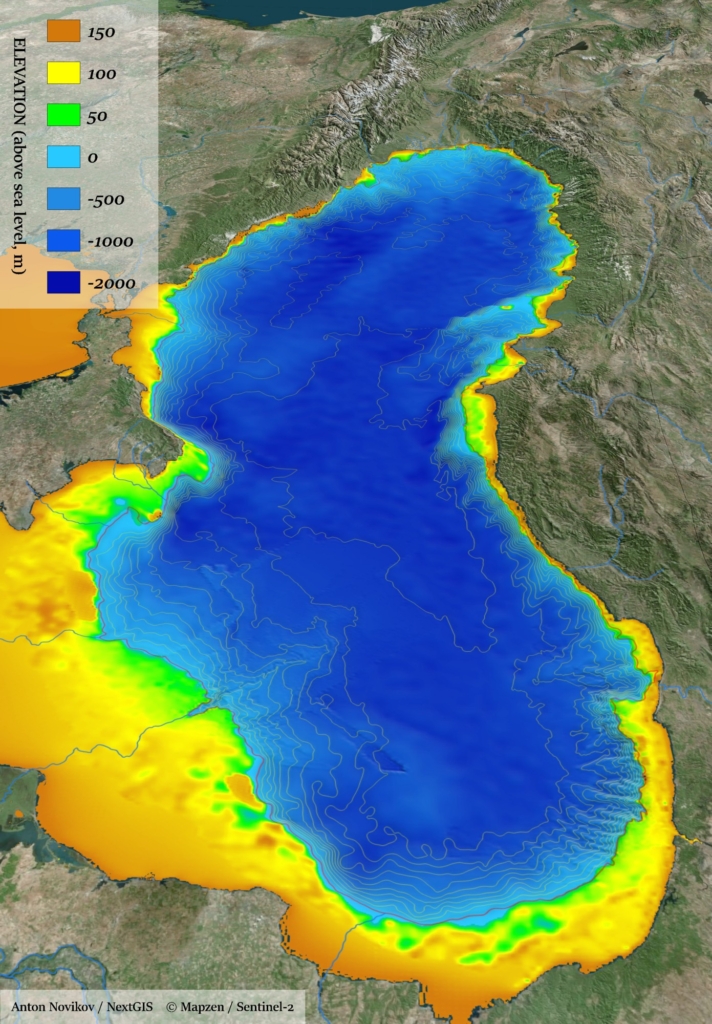
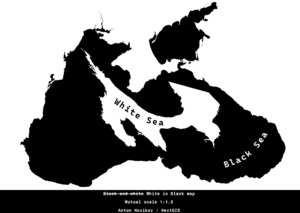
The map of Black Sea) with depth.
The level of the Black Sea was significantly lower ≈ 20,000 years ago. The vast territories of the modern shelf rose above the water by 100-150 m. And maybe there were mammoths running around.
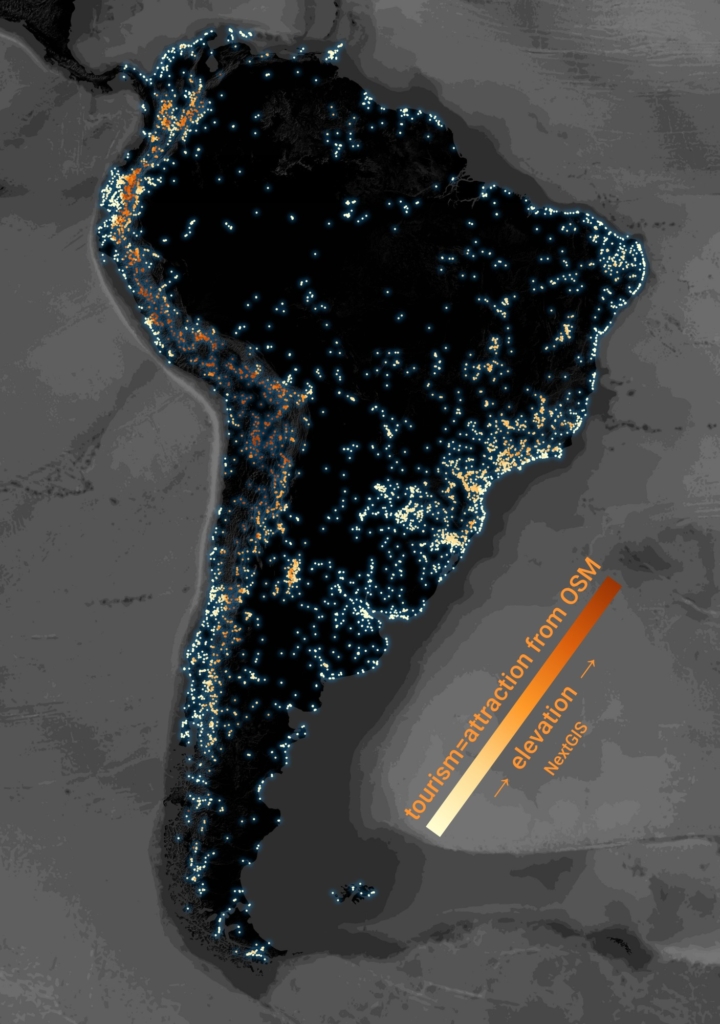
Attractions for tourists in South America colored by elevation value.
Order OpenStreetMap base data for any area via NextGIS Data. Choose from 25+ layers and get a ready-to-use QGIS project. Get 50% discount, if you order 5 layers or less.
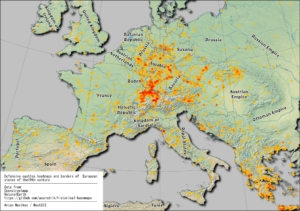
Map boundaries, tension points, or the outcomes of conflicts.
Black and white – an ideal combination, even in cartography.
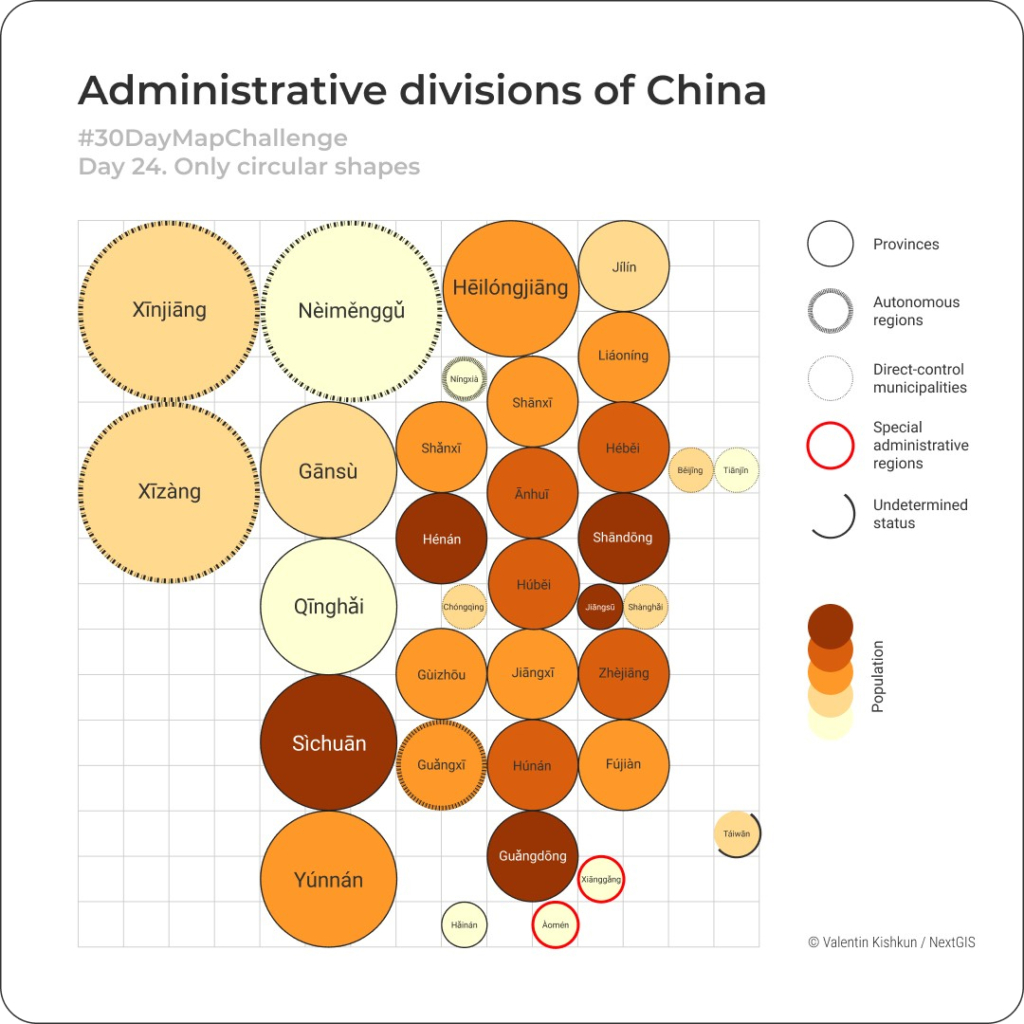
More of a diagram than a map. But hey, only circular shapes!
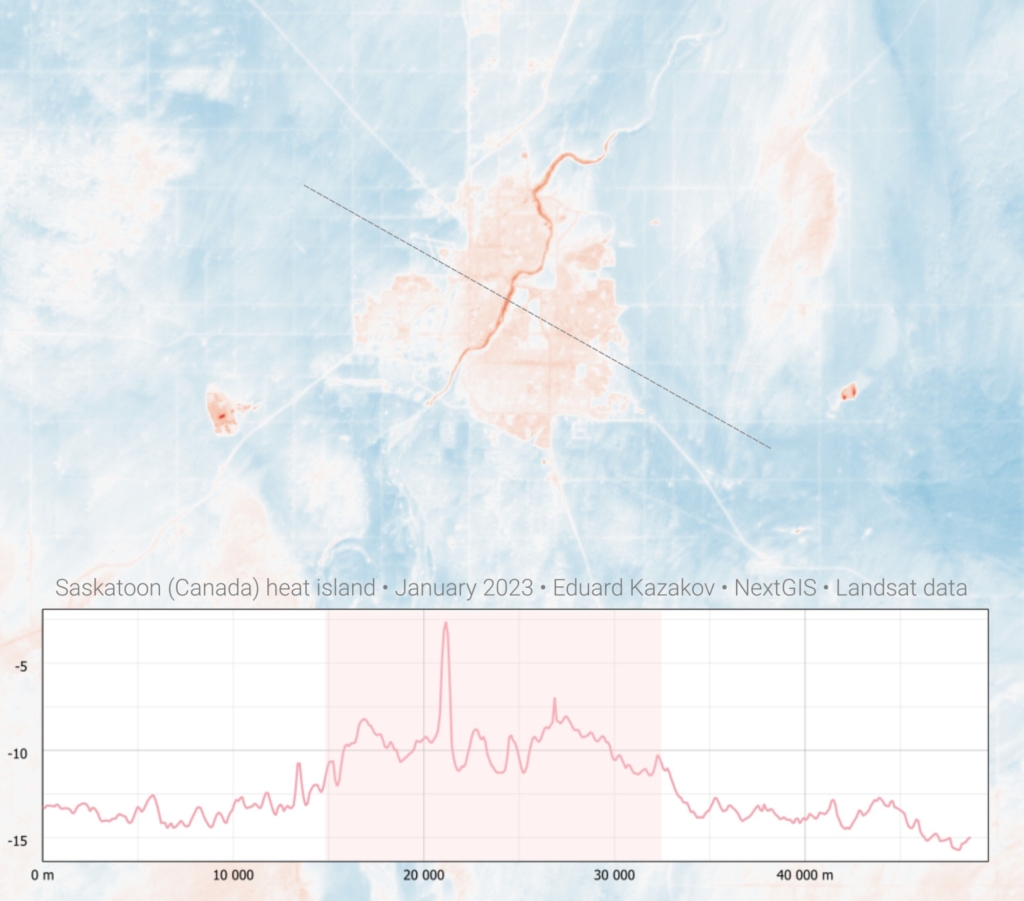
Saskatoon city urban heat island as seen from Landsat satellite.
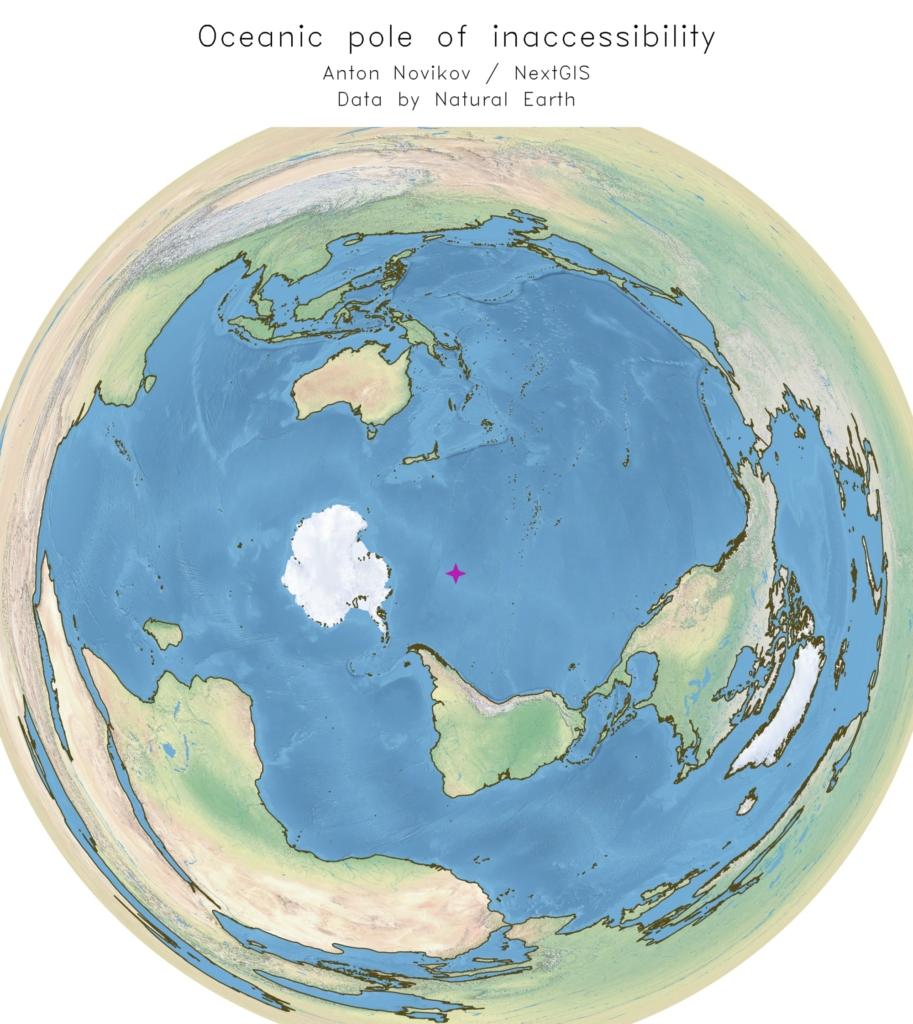
Oceanic pole of inaccessibility, or the point of Nemo is the place in the ocean that is farthest from land. We used Azimuthal Equidistant projection with the center at the Nemo point to show its remoteness.
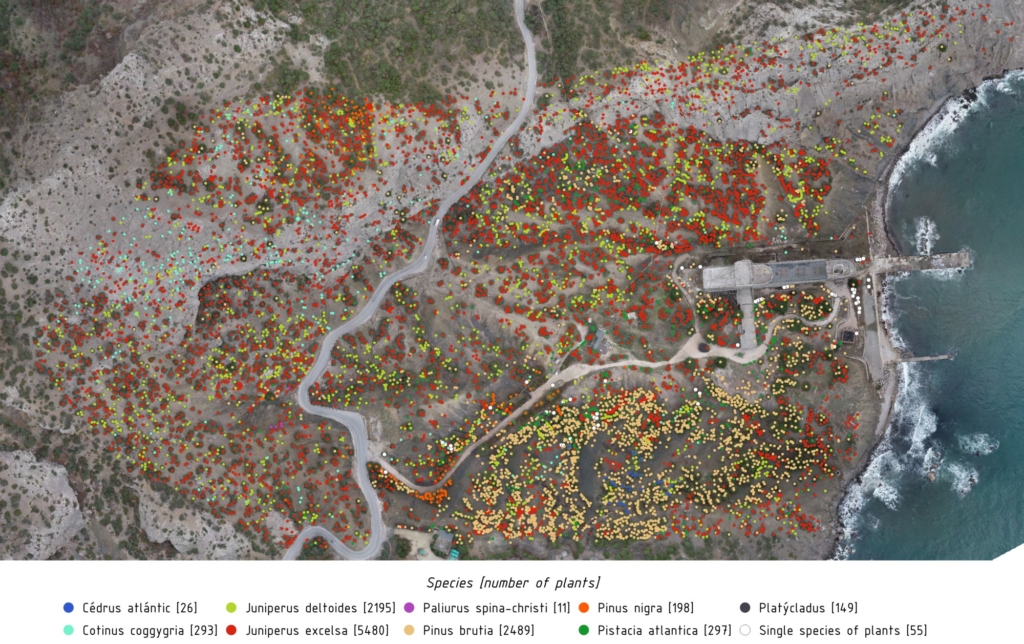
Micromapping in real life.
Buildings of Rio de Janeiro. Datasource ratio from: